|
Download Data (XLS File) |
|
||||||||
|
||||||||
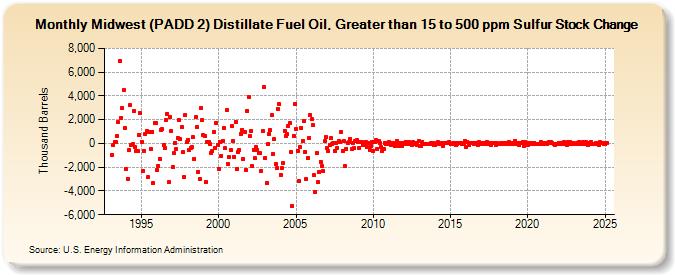
| Midwest (PADD 2) Distillate Fuel Oil, Greater than 15 to 500 ppm Sulfur Stock Change (Thousand Barrels) | ||||||||
| Year | Jan | Feb | Mar | Apr | May | Jun | Jul | Aug | Sep | Oct | Nov | Dec |
|---|---|---|---|---|---|---|---|---|---|---|---|---|
| 1993 | -960 | -174 | 109 | 85 | 625 | 1,778 | 6,928 | 2,177 | 2,986 | 4,461 | 1,320 | |
| 1994 | -2,151 | -2,953 | -584 | 3,199 | -102 | -86 | 2,734 | -297 | -654 | -598 | 717 | 2,542 |
| 1995 | 162 | -2,345 | -603 | 831 | 1,040 | -2,853 | 963 | -441 | 1,002 | -3,364 | 1,724 | 1,709 |
| 1996 | -2,257 | -1,882 | -1,272 | 1,168 | 1,214 | -165 | -361 | 2,009 | 2,480 | -3,255 | 2,198 | 1,051 |
| 1997 | -2,019 | -831 | 39 | -429 | 469 | 1,994 | 351 | 1,348 | -755 | -2,824 | 2,393 | 95 |
| 1998 | 316 | -544 | -357 | -339 | 504 | -1,279 | 2,209 | 1,423 | -2,395 | -3,006 | 2,970 | 1,988 |
| 1999 | 676 | 656 | -3,236 | 122 | 121 | -28 | -784 | -610 | 991 | -408 | 1,747 | -93 |
| 2000 | -2,136 | 82 | -1,018 | 204 | 1,285 | -426 | 2,783 | -1,693 | -1,145 | -515 | 1,475 | 219 |
| 2001 | -1,130 | 1,825 | -2,157 | -750 | -519 | 815 | 1,156 | -1,316 | 977 | -2,212 | 2,761 | 3,923 |
| 2002 | 627 | 1,046 | -1,915 | -514 | -1,262 | -329 | -543 | -834 | -834 | -2,281 | 1,018 | 4,741 |
| 2003 | -1,234 | -3,351 | -42 | 809 | 1,115 | 2,364 | -875 | 341 | -1,734 | -2,097 | 2,919 | 3,284 |
| 2004 | -2,634 | -2,051 | -1,686 | 1,074 | 627 | 767 | 1,497 | 1,721 | -730 | -5,260 | 666 | 3,329 |
| 2005 | 1,234 | -614 | -3,130 | -327 | 1,317 | 185 | 1,919 | -710 | -2,997 | -1,185 | 472 | 2,374 |
| 2006 | 2,027 | 1,522 | -2,677 | -4,081 | -826 | -3,276 | -2,395 | -1,534 | -1,918 | -2,318 | 245 | 526 |
| 2007 | -403 | -640 | -139 | 416 | -29 | 68 | -597 | 29 | -382 | 180 | 132 | 964 |
| 2008 | -596 | 200 | -1,904 | -436 | 67 | 98 | 373 | -470 | 77 | -397 | 180 | 274 |
| 2009 | 119 | -343 | 145 | 102 | -159 | -133 | 123 | -340 | 60 | -521 | -185 | 124 |
| 2010 | -635 | 82 | 257 | -427 | 201 | 73 | -260 | -597 | -450 | 66 | -25 | -33 |
| 2011 | 96 | 69 | -134 | 46 | -9 | -197 | 199 | -38 | -220 | 75 | -208 | 73 |
| 2012 | -25 | 135 | 48 | -88 | 97 | 8 | -123 | 79 | -52 | 12 | -107 | 193 |
| 2013 | -197 | -209 | 161 | -84 | -76 | -33 | -33 | -55 | -70 | 47 | 37 | -122 |
| 2014 | -135 | 23 | 83 | -35 | -12 | 51 | -177 | 56 | 10 | 16 | -4 | 83 |
| 2015 | -73 | -34 | 6 | 27 | -101 | -66 | 55 | 61 | 24 | -14 | -66 | 187 |
| 2016 | -267 | 154 | -130 | 36 | 57 | -1 | -21 | 60 | 48 | -150 | 105 | 56 |
| 2017 | -54 | 14 | 51 | -83 | 117 | -85 | 69 | -119 | 24 | 35 | 47 | -142 |
| 2018 | 10 | -24 | -65 | 28 | -12 | 38 | 76 | -69 | 8 | 85 | -79 | 62 |
| 2019 | -2 | -54 | 228 | -72 | 68 | -91 | -1 | 25 | 125 | -221 | 91 | 2 |
| 2020 | -92 | 31 | 10 | -41 | -54 | 38 | -45 | -36 | -10 | -85 | 81 | 25 |
| 2021 | -85 | 40 | 43 | -37 | 96 | 50 | 92 | 16 | -31 | -130 | -52 | -68 |
| 2022 | 72 | -32 | -4 | -44 | 101 | -21 | -114 | 119 | -28 | 100 | -64 | 76 |
| 2023 | -76 | -54 | 31 | -80 | 128 | -63 | -77 | 134 | -58 | 83 | 44 | -91 |
| 2024 | 26 | |||||||||||
| - = No Data Reported; -- = Not Applicable; NA = Not Available; W = Withheld to avoid disclosure of individual company data. |
| Release Date: 3/29/2024 |
| Next Release Date: 4/30/2024 |