|
Download Data (XLS File) |
|
||||||||
|
||||||||
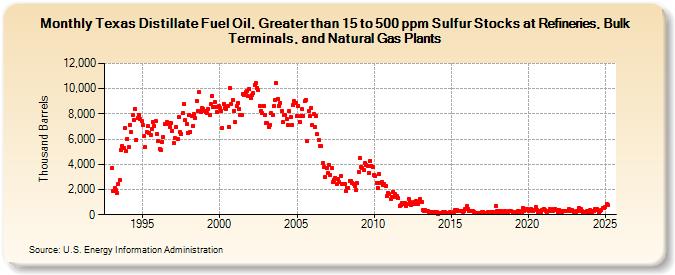
| Texas Distillate Fuel Oil, Greater than 15 to 500 ppm Sulfur Stocks at Refineries, Bulk Terminals, and Natural Gas Plants (Thousand Barrels) | ||||||||
| Year | Jan | Feb | Mar | Apr | May | Jun | Jul | Aug | Sep | Oct | Nov | Dec |
|---|---|---|---|---|---|---|---|---|---|---|---|---|
| 1993 | 3,708 | 1,872 | 2,157 | 1,925 | 1,703 | 2,467 | 2,754 | 5,156 | 5,452 | 5,296 | 6,860 | 5,023 |
| 1994 | 6,038 | 5,350 | 7,125 | 6,559 | 7,884 | 7,540 | 8,400 | 5,944 | 7,677 | 7,950 | 7,585 | 7,417 |
| 1995 | 7,108 | 6,213 | 5,335 | 6,545 | 7,037 | 6,508 | 6,322 | 6,776 | 7,393 | 7,015 | 7,406 | 6,408 |
| 1996 | 5,846 | 5,233 | 5,133 | 5,798 | 6,186 | 7,159 | 7,199 | 7,356 | 7,261 | 6,958 | 7,253 | 6,676 |
| 1997 | 5,669 | 6,074 | 6,996 | 6,010 | 7,758 | 6,587 | 6,377 | 8,049 | 8,748 | 7,491 | 7,219 | 6,496 |
| 1998 | 7,926 | 6,583 | 7,831 | 7,051 | 7,963 | 7,692 | 9,037 | 8,259 | 9,726 | 8,181 | 8,469 | 8,374 |
| 1999 | 8,239 | 8,170 | 8,067 | 8,413 | 7,925 | 8,780 | 9,441 | 8,575 | 8,931 | 8,573 | 8,114 | 8,594 |
| 2000 | 8,455 | 8,232 | 6,893 | 8,813 | 8,506 | 8,391 | 8,609 | 6,999 | 10,035 | 8,793 | 9,087 | 8,260 |
| 2001 | 7,369 | 8,600 | 8,894 | 8,396 | 7,922 | 7,894 | 9,567 | 9,513 | 9,712 | 9,836 | 9,396 | 9,974 |
| 2002 | 9,259 | 9,497 | 9,627 | 10,306 | 10,445 | 10,071 | 9,877 | 8,661 | 8,209 | 8,065 | 8,652 | 7,948 |
| 2003 | 7,298 | 7,257 | 6,995 | 7,131 | 8,059 | 7,881 | 8,623 | 9,074 | 10,470 | 9,178 | 8,654 | 8,902 |
| 2004 | 8,236 | 7,324 | 7,924 | 7,944 | 7,613 | 7,135 | 8,224 | 7,778 | 7,147 | 8,722 | 8,986 | 8,903 |
| 2005 | 7,795 | 8,650 | 7,382 | 7,848 | 8,361 | 7,859 | 9,000 | 9,130 | 5,811 | 8,248 | 7,804 | 8,471 |
| 2006 | 7,097 | 7,952 | 6,939 | 7,809 | 6,378 | 5,924 | 5,481 | 5,432 | 4,083 | 3,809 | 3,022 | 3,668 |
| 2007 | 3,312 | 3,919 | 3,156 | 3,706 | 2,572 | 2,792 | 2,951 | 2,442 | 2,796 | 2,575 | 3,091 | 2,451 |
| 2008 | 2,457 | 2,422 | 1,919 | 2,142 | 2,157 | 2,649 | 2,668 | 2,555 | 2,429 | 2,277 | 1,989 | 2,487 |
| 2009 | 3,425 | 4,499 | 3,799 | 3,693 | 3,511 | 4,076 | 3,949 | 3,889 | 3,346 | 4,275 | 3,889 | 3,800 |
| 2010 | 3,175 | 3,046 | 2,555 | 2,129 | 3,252 | 2,510 | 2,602 | 2,373 | 2,429 | 2,258 | 1,451 | 1,749 |
| 2011 | 1,623 | 1,215 | 1,412 | 1,805 | 1,607 | 1,433 | 1,476 | 1,312 | 719 | 779 | 941 | 818 |
| 2012 | 929 | 730 | 844 | 1,272 | 1,000 | 796 | 889 | 986 | 865 | 1,085 | 832 | 1,018 |
| 2013 | 1,236 | 1,007 | 340 | 287 | 338 | 302 | 313 | 192 | 236 | 180 | 199 | 177 |
| 2014 | 208 | 188 | 75 | 132 | 131 | 150 | 182 | 176 | 135 | 124 | 98 | 178 |
| 2015 | 163 | 162 | 195 | 367 | 265 | 335 | 304 | 313 | 313 | 249 | 315 | 468 |
| 2016 | 670 | 483 | 334 | 262 | 330 | 279 | 252 | 148 | 126 | 149 | 134 | 142 |
| 2017 | 214 | 233 | 145 | 164 | 149 | 183 | 171 | 178 | 224 | 215 | 149 | 720 |
| 2018 | 312 | 196 | 306 | 323 | 210 | 134 | 278 | 179 | 239 | 277 | 257 | 271 |
| 2019 | 166 | 221 | 235 | 174 | 263 | 273 | 238 | 253 | 571 | 332 | 422 | 430 |
| 2020 | 370 | 306 | 452 | 337 | 291 | 402 | 585 | 339 | 196 | 314 | 254 | 407 |
| 2021 | 486 | 336 | 268 | 244 | 304 | 452 | 396 | 265 | 459 | 480 | 384 | 213 |
| 2022 | 407 | 280 | 241 | 328 | 295 | 259 | 283 | 280 | 426 | 315 | 350 | 276 |
| 2023 | 247 | 233 | 302 | 289 | 543 | 467 | 268 | 122 | 212 | 192 | 262 | 182 |
| 2024 | 341 | |||||||||||
| - = No Data Reported; -- = Not Applicable; NA = Not Available; W = Withheld to avoid disclosure of individual company data. |
| Release Date: 3/29/2024 |
| Next Release Date: 4/30/2024 |