|
Download Data (XLS File) |
|
||||||||
|
||||||||
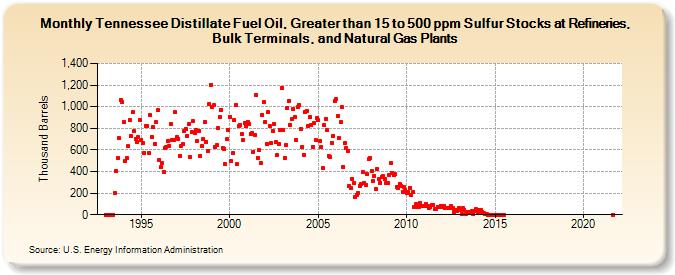
| Tennessee Distillate Fuel Oil, Greater than 15 to 500 ppm Sulfur Stocks at Refineries, Bulk Terminals, and Natural Gas Plants (Thousand Barrels) | ||||||||
| Year | Jan | Feb | Mar | Apr | May | Jun | Jul | Aug | Sep | Oct | Nov | Dec |
|---|---|---|---|---|---|---|---|---|---|---|---|---|
| 1993 | 0 | 0 | 0 | 0 | 0 | 0 | 197 | 404 | 528 | 707 | 1,066 | 1,042 |
| 1994 | 860 | 495 | 525 | 633 | 875 | 726 | 947 | 771 | 700 | 675 | 719 | 875 |
| 1995 | 692 | 664 | 571 | 819 | 819 | 574 | 921 | 724 | 810 | 658 | 858 | 966 |
| 1996 | 511 | 439 | 475 | 395 | 621 | 630 | 679 | 640 | 844 | 696 | 694 | 950 |
| 1997 | 718 | 704 | 544 | 638 | 651 | 777 | 798 | 729 | 838 | 535 | 765 | 863 |
| 1998 | 760 | 784 | 682 | 777 | 548 | 636 | 702 | 856 | 676 | 586 | 1,022 | 1,201 |
| 1999 | 1,000 | 1,012 | 631 | 645 | 800 | 903 | 973 | 616 | 611 | 466 | 697 | 782 |
| 2000 | 905 | 493 | 568 | 876 | 1,017 | 466 | 822 | 830 | 746 | 692 | 851 | 817 |
| 2001 | 860 | 843 | 750 | 756 | 583 | 741 | 1,107 | 528 | 599 | 482 | 924 | 1,043 |
| 2002 | 854 | 653 | 948 | 824 | 664 | 778 | 840 | 670 | 554 | 650 | 787 | 1,177 |
| 2003 | 784 | 527 | 647 | 990 | 1,053 | 830 | 883 | 976 | 904 | 690 | 994 | 1,017 |
| 2004 | 797 | 624 | 556 | 950 | 961 | 818 | 900 | 832 | 631 | 845 | 689 | 894 |
| 2005 | 873 | 681 | 627 | 436 | 829 | 887 | 782 | 546 | 534 | 662 | 732 | 1,050 |
| 2006 | 1,067 | 918 | 708 | 854 | 994 | 443 | 666 | 614 | 586 | 265 | 247 | 334 |
| 2007 | 295 | 168 | 187 | 200 | 268 | 282 | 399 | 295 | 279 | 376 | 513 | 526 |
| 2008 | 405 | 314 | 362 | 237 | 424 | 331 | 297 | 353 | 355 | 331 | 294 | 293 |
| 2009 | 368 | 479 | 387 | 367 | 374 | 257 | 243 | 287 | 269 | 214 | 257 | 225 |
| 2010 | 197 | 210 | 250 | 181 | 209 | 71 | 96 | 75 | 74 | 106 | 83 | 80 |
| 2011 | 84 | 102 | 80 | 65 | 70 | 86 | 91 | 53 | 54 | 75 | 68 | 82 |
| 2012 | 76 | 77 | 58 | 63 | 62 | 59 | 81 | 60 | 26 | 44 | 37 | 66 |
| 2013 | 44 | 5 | 61 | 46 | 8 | 22 | 22 | 23 | 34 | 11 | 33 | 49 |
| 2014 | 24 | 48 | 42 | 25 | 16 | 6 | 3 | 1 | 1 | 1 | 1 | 1 |
| 2015 | 1 | 1 | 1 | 1 | 1 | 1 | 1 | |||||
| 2021 | 0 | |||||||||||
| - = No Data Reported; -- = Not Applicable; NA = Not Available; W = Withheld to avoid disclosure of individual company data. |
| Release Date: 3/29/2024 |
| Next Release Date: 4/30/2024 |