|
Download Data (XLS File) |
|
||||||||
|
||||||||
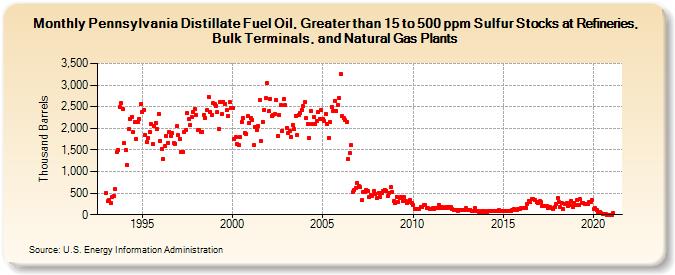
| Pennsylvania Distillate Fuel Oil, Greater than 15 to 500 ppm Sulfur Stocks at Refineries, Bulk Terminals, and Natural Gas Plants (Thousand Barrels) | ||||||||
| Year | Jan | Feb | Mar | Apr | May | Jun | Jul | Aug | Sep | Oct | Nov | Dec |
|---|---|---|---|---|---|---|---|---|---|---|---|---|
| 1993 | 500 | 306 | 350 | 279 | 404 | 429 | 589 | 1,444 | 1,495 | 2,495 | 2,581 | 2,440 |
| 1994 | 1,651 | 1,493 | 1,146 | 1,982 | 2,225 | 2,256 | 1,907 | 2,146 | 1,755 | 2,138 | 2,215 | 2,556 |
| 1995 | 2,373 | 2,433 | 1,856 | 1,672 | 1,766 | 1,919 | 2,090 | 1,636 | 2,064 | 2,129 | 1,992 | 2,336 |
| 1996 | 1,714 | 1,532 | 1,290 | 1,584 | 1,831 | 1,668 | 1,915 | 1,825 | 1,887 | 1,650 | 1,647 | 2,051 |
| 1997 | 1,842 | 1,754 | 1,452 | 1,459 | 1,917 | 1,967 | 2,346 | 2,209 | 2,074 | 2,259 | 2,374 | 2,436 |
| 1998 | 2,314 | 1,949 | 1,958 | 1,911 | 1,921 | 2,314 | 2,240 | 2,413 | 2,733 | 2,379 | 2,311 | 2,580 |
| 1999 | 2,556 | 2,523 | 2,370 | 1,978 | 2,605 | 2,330 | 2,618 | 2,564 | 2,426 | 2,275 | 2,604 | 2,479 |
| 2000 | 2,470 | 1,746 | 1,790 | 1,625 | 1,607 | 1,806 | 2,148 | 2,238 | 1,896 | 1,877 | 2,273 | 2,112 |
| 2001 | 2,236 | 2,193 | 1,605 | 2,034 | 1,951 | 2,050 | 2,645 | 1,704 | 2,153 | 2,434 | 2,695 | 3,048 |
| 2002 | 2,393 | 2,688 | 2,280 | 2,313 | 2,328 | 2,659 | 1,822 | 2,309 | 2,534 | 1,945 | 2,673 | 2,532 |
| 2003 | 2,014 | 1,887 | 1,936 | 1,810 | 2,076 | 1,977 | 2,292 | 1,844 | 2,310 | 2,356 | 2,422 | 2,512 |
| 2004 | 2,608 | 2,237 | 2,100 | 1,779 | 2,392 | 2,110 | 2,254 | 2,103 | 2,175 | 2,367 | 2,219 | 2,422 |
| 2005 | 2,221 | 2,160 | 2,336 | 2,096 | 1,778 | 2,147 | 2,482 | 2,404 | 2,642 | 2,399 | 2,549 | 2,700 |
| 2006 | 3,246 | 2,282 | 2,239 | 2,194 | 2,147 | 1,287 | 1,426 | 1,613 | 519 | 582 | 628 | 734 |
| 2007 | 662 | 630 | 340 | 534 | 515 | 579 | 551 | 414 | 452 | 425 | 556 | 482 |
| 2008 | 393 | 508 | 403 | 496 | 543 | 583 | 555 | 428 | 498 | 635 | 525 | 307 |
| 2009 | 265 | 420 | 295 | 396 | 410 | 306 | 408 | 321 | 277 | 303 | 339 | 261 |
| 2010 | 222 | 143 | 134 | 132 | 126 | 179 | 178 | 214 | 222 | 152 | 147 | 128 |
| 2011 | 141 | 149 | 141 | 162 | 154 | 234 | 159 | 168 | 147 | 164 | 167 | 161 |
| 2012 | 174 | 169 | 130 | 112 | 102 | 108 | 92 | 99 | 106 | 110 | 120 | 146 |
| 2013 | 111 | 113 | 120 | 76 | 93 | 157 | 95 | 92 | 74 | 71 | 77 | 95 |
| 2014 | 68 | 66 | 86 | 84 | 79 | 86 | 86 | 83 | 97 | 98 | 92 | 97 |
| 2015 | 90 | 87 | 87 | 85 | 92 | 85 | 99 | 125 | 118 | 108 | 131 | 131 |
| 2016 | 151 | 160 | 160 | 151 | 243 | 318 | 288 | 359 | 361 | 340 | 284 | 261 |
| 2017 | 310 | 285 | 196 | 194 | 195 | 196 | 158 | 174 | 153 | 140 | 175 | 240 |
| 2018 | 397 | 290 | 171 | 264 | 136 | 247 | 268 | 196 | 215 | 326 | 175 | 282 |
| 2019 | 232 | 329 | 234 | 359 | 282 | 279 | 255 | 257 | 259 | 292 | 302 | 333 |
| 2020 | 121 | 148 | 113 | 56 | 71 | 38 | 27 | 21 | 13 | 3 | 2 | 2 |
| 2021 | 3 | 44 | ||||||||||
| - = No Data Reported; -- = Not Applicable; NA = Not Available; W = Withheld to avoid disclosure of individual company data. |
| Release Date: 3/29/2024 |
| Next Release Date: 4/30/2024 |