|
Download Data (XLS File) |
|
||||||||
|
||||||||
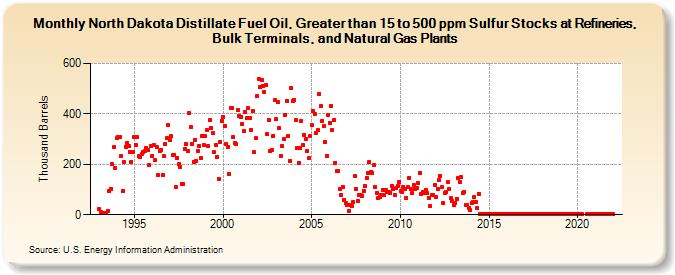
| North Dakota Distillate Fuel Oil, Greater than 15 to 500 ppm Sulfur Stocks at Refineries, Bulk Terminals, and Natural Gas Plants (Thousand Barrels) | ||||||||
| Year | Jan | Feb | Mar | Apr | May | Jun | Jul | Aug | Sep | Oct | Nov | Dec |
|---|---|---|---|---|---|---|---|---|---|---|---|---|
| 1993 | 21 | 10 | 7 | 6 | 6 | 6 | 16 | 96 | 104 | 201 | 267 | 185 |
| 1994 | 303 | 310 | 310 | 231 | 93 | 210 | 270 | 286 | 272 | 248 | 211 | 247 |
| 1995 | 307 | 277 | 308 | 232 | 230 | 240 | 248 | 253 | 264 | 256 | 197 | 273 |
| 1996 | 234 | 276 | 217 | 267 | 157 | 251 | 257 | 156 | 231 | 279 | 304 | 356 |
| 1997 | 296 | 311 | 235 | 235 | 110 | 226 | 201 | 188 | 123 | 123 | 260 | 280 |
| 1998 | 251 | 402 | 349 | 281 | 210 | 298 | 214 | 253 | 272 | 225 | 314 | 276 |
| 1999 | 312 | 336 | 272 | 374 | 346 | 325 | 247 | 275 | 230 | 143 | 290 | 373 |
| 2000 | 387 | 351 | 281 | 269 | 163 | 423 | 423 | 308 | 284 | 279 | 415 | 393 |
| 2001 | 389 | 360 | 331 | 408 | 382 | 422 | 384 | 337 | 413 | 247 | 303 | 472 |
| 2002 | 538 | 505 | 534 | 510 | 487 | 514 | 319 | 374 | 251 | 258 | 314 | 455 |
| 2003 | 379 | 446 | 344 | 232 | 273 | 300 | 397 | 453 | 312 | 215 | 503 | 451 |
| 2004 | 454 | 376 | 263 | 207 | 263 | 372 | 276 | 318 | 300 | 252 | 225 | 311 |
| 2005 | 357 | 411 | 398 | 326 | 337 | 480 | 430 | 372 | 350 | 290 | 234 | 394 |
| 2006 | 365 | 430 | 336 | 375 | 207 | 172 | 174 | 102 | 80 | 110 | 57 | 45 |
| 2007 | 40 | 16 | 38 | 35 | 50 | 152 | 104 | 53 | 79 | 77 | 74 | 96 |
| 2008 | 114 | 146 | 166 | 211 | 169 | 167 | 197 | 110 | 88 | 65 | 70 | 80 |
| 2009 | 97 | 77 | 99 | 91 | 89 | 88 | 115 | 103 | 78 | 106 | 113 | 128 |
| 2010 | 93 | 91 | 109 | 101 | 67 | 111 | 147 | 104 | 85 | 119 | 102 | 107 |
| 2011 | 126 | 167 | 83 | 90 | 88 | 100 | 87 | 68 | 33 | 77 | 78 | 118 |
| 2012 | 69 | 102 | 136 | 154 | 110 | 45 | 87 | 90 | 128 | 102 | 65 | 56 |
| 2013 | 37 | 48 | 64 | 147 | 129 | 148 | 87 | 90 | 40 | 39 | 27 | 18 |
| 2014 | 47 | 50 | 69 | 51 | 26 | 84 | 1 | 1 | 1 | 1 | 2 | 1 |
| 2015 | 1 | 1 | 2 | 1 | 1 | 1 | 1 | 1 | 1 | 1 | 1 | 1 |
| 2016 | 1 | 1 | 1 | 1 | 1 | 1 | 2 | 2 | 1 | 1 | 1 | 1 |
| 2017 | 1 | 1 | 1 | 1 | 1 | 1 | 1 | 1 | 1 | 1 | 1 | 1 |
| 2018 | 1 | 1 | 1 | 1 | 1 | 2 | 1 | 1 | 1 | 1 | 1 | 1 |
| 2019 | 1 | 2 | 1 | 1 | 2 | 1 | 1 | 1 | 1 | 1 | 1 | 2 |
| 2020 | 1 | 1 | 1 | 1 | 1 | 1 | 1 | 1 | 1 | 1 | ||
| 2021 | 1 | 2 | 1 | 1 | 1 | 1 | 1 | 1 | 1 | 1 | 1 | 1 |
| 2022 | 1 | |||||||||||
| - = No Data Reported; -- = Not Applicable; NA = Not Available; W = Withheld to avoid disclosure of individual company data. |
| Release Date: 3/29/2024 |
| Next Release Date: 4/30/2024 |