|
Download Data (XLS File) |
|
||||||||
|
||||||||
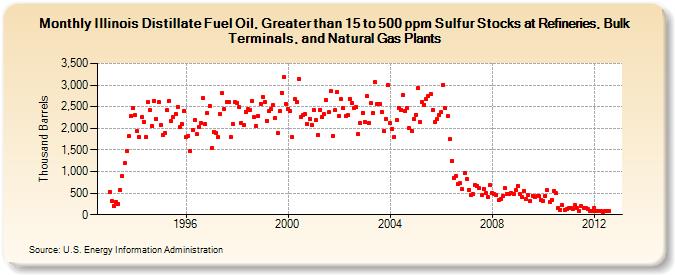
| Illinois Distillate Fuel Oil, Greater than 15 to 500 ppm Sulfur Stocks at Refineries, Bulk Terminals, and Natural Gas Plants (Thousand Barrels) | ||||||||
| Year | Jan | Feb | Mar | Apr | May | Jun | Jul | Aug | Sep | Oct | Nov | Dec |
|---|---|---|---|---|---|---|---|---|---|---|---|---|
| 1993 | 537 | 315 | 197 | 299 | 257 | 571 | 892 | 1,190 | 1,477 | 1,820 | 2,281 | 2,476 |
| 1994 | 2,303 | 1,931 | 1,804 | 2,255 | 2,154 | 1,795 | 2,599 | 2,426 | 2,051 | 2,634 | 2,226 | 2,606 |
| 1995 | 2,066 | 1,851 | 1,901 | 2,416 | 2,632 | 2,162 | 2,260 | 2,331 | 2,503 | 2,035 | 2,088 | 2,410 |
| 1996 | 1,788 | 1,833 | 1,472 | 1,952 | 2,199 | 1,862 | 2,033 | 2,115 | 2,691 | 2,097 | 2,350 | 2,526 |
| 1997 | 1,554 | 1,912 | 1,884 | 1,790 | 2,335 | 2,806 | 2,451 | 2,602 | 2,610 | 1,789 | 2,101 | 2,603 |
| 1998 | 2,594 | 2,483 | 2,124 | 2,066 | 2,384 | 2,436 | 2,431 | 2,635 | 2,250 | 2,049 | 2,292 | 2,566 |
| 1999 | 2,731 | 2,615 | 2,177 | 2,399 | 2,441 | 2,533 | 2,246 | 1,895 | 2,389 | 2,828 | 3,180 | 2,565 |
| 2000 | 2,458 | 2,400 | 1,787 | 2,672 | 2,601 | 3,141 | 2,253 | 2,315 | 2,327 | 2,107 | 2,222 | 2,084 |
| 2001 | 2,425 | 2,182 | 1,849 | 2,431 | 2,257 | 2,320 | 2,644 | 2,370 | 2,857 | 1,832 | 2,417 | 2,833 |
| 2002 | 2,287 | 2,667 | 2,474 | 2,279 | 2,299 | 2,681 | 2,581 | 2,469 | 2,483 | 1,869 | 2,120 | 2,361 |
| 2003 | 2,154 | 2,740 | 2,121 | 2,581 | 2,346 | 3,060 | 2,569 | 2,568 | 2,387 | 1,930 | 2,216 | 2,992 |
| 2004 | 2,125 | 1,985 | 1,800 | 2,190 | 2,478 | 2,433 | 2,763 | 2,410 | 2,468 | 2,000 | 1,939 | 2,213 |
| 2005 | 2,315 | 2,925 | 2,148 | 2,607 | 2,548 | 2,667 | 2,744 | 2,790 | 2,426 | 2,139 | 2,209 | 2,313 |
| 2006 | 2,377 | 3,002 | 2,463 | 2,275 | 1,742 | 1,254 | 856 | 898 | 711 | 723 | 588 | 956 |
| 2007 | 827 | 569 | 465 | 483 | 685 | 675 | 612 | 447 | 600 | 498 | 412 | 679 |
| 2008 | 512 | 478 | 445 | 331 | 371 | 423 | 614 | 477 | 488 | 499 | 488 | 570 |
| 2009 | 659 | 470 | 399 | 546 | 365 | 449 | 309 | 443 | 408 | 427 | 427 | 348 |
| 2010 | 320 | 435 | 563 | 294 | 343 | 539 | 496 | 164 | 117 | 222 | 118 | 121 |
| 2011 | 148 | 157 | 132 | 217 | 147 | 83 | 193 | 151 | 151 | 125 | 85 | 85 |
| 2012 | 154 | 87 | 91 | 90 | 68 | 77 | 82 | 79 | ||||
| - = No Data Reported; -- = Not Applicable; NA = Not Available; W = Withheld to avoid disclosure of individual company data. |
| Release Date: 6/28/2024 |
| Next Release Date: 7/31/2024 |