|
Download Data (XLS File) |
|
||||||||
|
||||||||
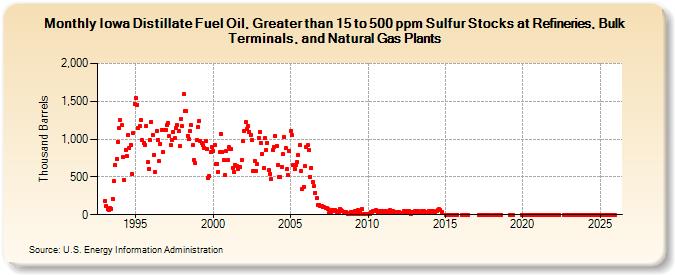
| Iowa Distillate Fuel Oil, Greater than 15 to 500 ppm Sulfur Stocks at Refineries, Bulk Terminals, and Natural Gas Plants (Thousand Barrels) | ||||||||
| Year | Jan | Feb | Mar | Apr | May | Jun | Jul | Aug | Sep | Oct | Nov | Dec |
|---|---|---|---|---|---|---|---|---|---|---|---|---|
| 1993 | 179 | 120 | 78 | 66 | 89 | 82 | 214 | 440 | 656 | 738 | 963 | 1,149 |
| 1994 | 1,247 | 1,182 | 757 | 458 | 861 | 774 | 1,056 | 876 | 922 | 542 | 1,085 | 1,465 |
| 1995 | 1,546 | 1,455 | 1,151 | 1,171 | 1,251 | 984 | 952 | 926 | 1,176 | 692 | 611 | 983 |
| 1996 | 1,228 | 1,060 | 794 | 571 | 1,111 | 994 | 705 | 941 | 1,124 | 829 | 1,118 | 1,126 |
| 1997 | 1,182 | 1,210 | 1,037 | 919 | 991 | 1,100 | 1,010 | 1,146 | 1,187 | 1,105 | 903 | 1,272 |
| 1998 | 1,170 | 1,590 | 1,373 | 1,371 | 1,045 | 995 | 1,105 | 1,182 | 920 | 726 | 679 | 990 |
| 1999 | 1,164 | 1,241 | 975 | 945 | 917 | 886 | 978 | 868 | 492 | 508 | 823 | 892 |
| 2000 | 841 | 927 | 671 | 675 | 571 | 825 | 1,067 | 827 | 717 | 526 | 837 | 718 |
| 2001 | 889 | 874 | 864 | 619 | 564 | 658 | 643 | 605 | 625 | 627 | 730 | 971 |
| 2002 | 1,108 | 1,226 | 1,138 | 1,167 | 1,098 | 1,060 | 991 | 578 | 713 | 582 | 669 | 1,011 |
| 2003 | 1,089 | 950 | 806 | 616 | 1,012 | 860 | 954 | 585 | 544 | 469 | 854 | 901 |
| 2004 | 1,043 | 910 | 655 | 497 | 502 | 635 | 798 | 1,029 | 878 | 602 | 521 | 841 |
| 2005 | 1,111 | 1,050 | 654 | 605 | 663 | 694 | 789 | 922 | 576 | 341 | 371 | 643 |
| 2006 | 897 | 916 | 856 | 504 | 624 | 435 | 375 | 291 | 222 | 131 | 130 | 112 |
| 2007 | 119 | 107 | 96 | 95 | 91 | 77 | 27 | 39 | 63 | 55 | 63 | 55 |
| 2008 | 34 | 41 | 80 | 64 | 49 | 31 | 32 | 40 | 16 | 9 | 20 | 32 |
| 2009 | 16 | 42 | 48 | 7 | 59 | 8 | 54 | 78 | 10 | 10 | 10 | 10 |
| 2010 | 10 | 10 | 34 | 31 | 53 | 53 | 61 | 46 | 38 | 44 | 40 | 43 |
| 2011 | 24 | 47 | 38 | 36 | 53 | 59 | 36 | 50 | 27 | 20 | 41 | 40 |
| 2012 | 41 | 24 | 28 | 24 | 45 | 45 | 26 | 38 | 46 | 11 | 39 | 38 |
| 2013 | 43 | 37 | 28 | 44 | 30 | 33 | 52 | 44 | 41 | 23 | 28 | 46 |
| 2014 | 40 | 45 | 44 | 38 | 37 | 54 | 56 | 69 | 60 | 32 | ||
| 2015 | 1 | 1 | 1 | 1 | 1 | 1 | 1 | 1 | ||||
| 2016 | 1 | 1 | 1 | 1 | 1 | |||||||
| 2017 | 1 | 1 | 2 | 1 | 1 | 1 | 1 | 1 | 1 | |||
| 2018 | 1 | 1 | 1 | 1 | 1 | 1 | ||||||
| 2019 | 1 | 1 | 1 | 1 | ||||||||
| 2020 | 1 | 1 | 1 | 1 | 1 | 1 | 1 | 1 | 1 | 1 | 1 | 1 |
| 2021 | 1 | 2 | 2 | 2 | 2 | 1 | 1 | 1 | 1 | 1 | 2 | 1 |
| 2022 | 2 | 2 | 1 | 1 | 1 | 1 | 1 | 1 | 1 | |||
| 2023 | 1 | 1 | 1 | 1 | 1 | 1 | 1 | 1 | 1 | 1 | 1 | |
| 2024 | 1 | |||||||||||
| - = No Data Reported; -- = Not Applicable; NA = Not Available; W = Withheld to avoid disclosure of individual company data. |
| Release Date: 3/29/2024 |
| Next Release Date: 4/30/2024 |