|
Download Data (XLS File) |
|
||||||||
|
||||||||
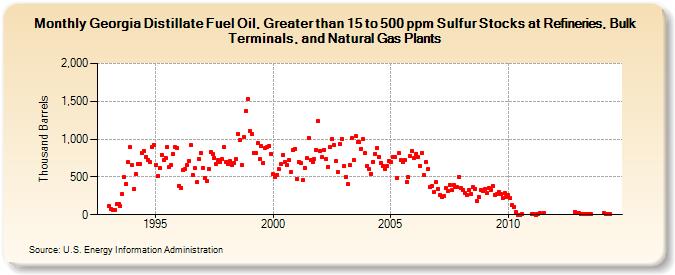
| Georgia Distillate Fuel Oil, Greater than 15 to 500 ppm Sulfur Stocks at Refineries, Bulk Terminals, and Natural Gas Plants (Thousand Barrels) | ||||||||
| Year | Jan | Feb | Mar | Apr | May | Jun | Jul | Aug | Sep | Oct | Nov | Dec |
|---|---|---|---|---|---|---|---|---|---|---|---|---|
| 1993 | 114 | 77 | 61 | 64 | 138 | 144 | 109 | 272 | 502 | 409 | 696 | 891 |
| 1994 | 652 | 337 | 533 | 673 | 672 | 816 | 845 | 767 | 728 | 700 | 894 | 927 |
| 1995 | 664 | 507 | 614 | 795 | 720 | 754 | 892 | 627 | 655 | 807 | 891 | 880 |
| 1996 | 384 | 357 | 587 | 605 | 651 | 704 | 925 | 529 | 612 | 427 | 738 | 817 |
| 1997 | 620 | 490 | 445 | 611 | 825 | 803 | 752 | 672 | 726 | 691 | 733 | 892 |
| 1998 | 701 | 665 | 707 | 657 | 689 | 733 | 1,072 | 985 | 657 | 1,025 | 1,369 | 1,534 |
| 1999 | 1,108 | 1,065 | 822 | 821 | 943 | 732 | 910 | 686 | 877 | 893 | 915 | 804 |
| 2000 | 533 | 504 | 530 | 598 | 672 | 796 | 692 | 655 | 725 | 560 | 852 | 875 |
| 2001 | 477 | 702 | 689 | 456 | 622 | 748 | 1,019 | 725 | 699 | 738 | 860 | 1,234 |
| 2002 | 846 | 757 | 860 | 733 | 628 | 891 | 1,005 | 926 | 712 | 559 | 932 | 1,004 |
| 2003 | 648 | 501 | 406 | 654 | 1,010 | 726 | 1,037 | 964 | 957 | 874 | 999 | 811 |
| 2004 | 645 | 601 | 543 | 698 | 809 | 881 | 769 | 685 | 645 | 604 | 649 | 711 |
| 2005 | 692 | 766 | 759 | 482 | 813 | 719 | 694 | 728 | 433 | 493 | 778 | 841 |
| 2006 | 755 | 809 | 759 | 642 | 821 | 519 | 698 | 598 | 368 | 382 | 300 | 433 |
| 2007 | 345 | 267 | 237 | 242 | 352 | 317 | 394 | 326 | 397 | 371 | 360 | 501 |
| 2008 | 348 | 330 | 282 | 257 | 328 | 274 | 360 | 345 | 178 | 237 | 333 | 317 |
| 2009 | 343 | 288 | 350 | 321 | 384 | 265 | 268 | 303 | 278 | 222 | 281 | 240 |
| 2010 | 260 | 216 | 126 | 108 | 37 | 2 | 1 | 3 | ||||
| 2011 | 9 | 7 | 1 | 13 | 17 | 26 | ||||||
| 2012 | 40 | 28 | ||||||||||
| 2013 | 20 | 16 | 13 | 13 | 11 | 8 | 5 | |||||
| 2014 | 20 | 13 | 5 | 5 | ||||||||
| - = No Data Reported; -- = Not Applicable; NA = Not Available; W = Withheld to avoid disclosure of individual company data. |
| Release Date: 8/30/2024 |
| Next Release Date: 9/30/2024 |