|
Download Data (XLS File) |
|
||||||||
|
||||||||
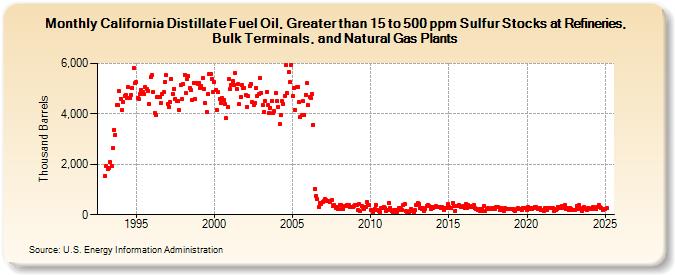
| California Distillate Fuel Oil, Greater than 15 to 500 ppm Sulfur Stocks at Refineries, Bulk Terminals, and Natural Gas Plants (Thousand Barrels) | ||||||||
| Year | Jan | Feb | Mar | Apr | May | Jun | Jul | Aug | Sep | Oct | Nov | Dec |
|---|---|---|---|---|---|---|---|---|---|---|---|---|
| 1993 | 1,541 | 1,937 | 1,821 | 1,857 | 2,089 | 1,947 | 2,641 | 3,373 | 3,175 | 4,355 | 4,338 | 4,892 |
| 1994 | 4,607 | 4,167 | 4,476 | 4,721 | 4,743 | 4,632 | 5,061 | 4,612 | 4,740 | 5,024 | 5,812 | 5,213 |
| 1995 | 5,254 | 4,627 | 4,582 | 4,792 | 4,957 | 4,886 | 4,794 | 5,058 | 4,994 | 4,924 | 4,396 | 5,459 |
| 1996 | 5,534 | 4,882 | 4,048 | 3,966 | 4,652 | 4,660 | 4,679 | 4,414 | 4,776 | 4,851 | 5,271 | 5,538 |
| 1997 | 4,376 | 4,287 | 4,467 | 5,389 | 4,808 | 5,001 | 4,609 | 4,531 | 4,492 | 4,138 | 5,148 | 4,588 |
| 1998 | 5,174 | 5,556 | 4,829 | 5,383 | 5,490 | 5,019 | 4,929 | 4,551 | 5,240 | 4,606 | 5,229 | 5,195 |
| 1999 | 5,215 | 5,033 | 5,104 | 5,440 | 4,991 | 4,431 | 4,067 | 4,776 | 5,565 | 5,593 | 5,398 | 4,858 |
| 2000 | 5,262 | 4,931 | 4,148 | 4,850 | 4,609 | 4,421 | 4,621 | 4,535 | 4,373 | 3,826 | 4,284 | 5,365 |
| 2001 | 4,977 | 5,165 | 5,303 | 5,154 | 5,618 | 4,998 | 5,172 | 4,373 | 4,664 | 5,145 | 5,032 | 5,041 |
| 2002 | 4,732 | 4,284 | 4,699 | 5,103 | 5,205 | 4,467 | 4,354 | 4,447 | 5,044 | 4,718 | 4,774 | 5,442 |
| 2003 | 4,829 | 4,341 | 4,092 | 4,512 | 4,872 | 4,335 | 4,019 | 4,251 | 4,527 | 4,018 | 4,114 | 4,836 |
| 2004 | 4,515 | 4,279 | 3,588 | 3,945 | 4,496 | 4,406 | 4,711 | 5,920 | 4,817 | 5,670 | 5,264 | 5,951 |
| 2005 | 4,713 | 5,046 | 4,171 | 5,053 | 5,081 | 4,466 | 3,866 | 3,945 | 4,498 | 3,941 | 4,766 | 5,220 |
| 2006 | 4,335 | 4,662 | 4,630 | 4,798 | 3,578 | 1,032 | 760 | 607 | 294 | 475 | 422 | 519 |
| 2007 | 552 | 613 | 569 | 529 | 547 | 486 | 566 | 355 | 399 | 268 | 296 | 228 |
| 2008 | 384 | 400 | 220 | 209 | 358 | 353 | 366 | 380 | 323 | 304 | 302 | 360 |
| 2009 | 385 | 379 | 176 | 408 | 134 | 330 | 322 | 241 | 324 | 495 | 386 | 375 |
| 2010 | 199 | 181 | 124 | 220 | 397 | 189 | 155 | 119 | 247 | 267 | 308 | 261 |
| 2011 | 149 | 172 | 477 | 273 | 152 | 88 | 178 | 180 | 124 | 180 | 277 | 232 |
| 2012 | 197 | 384 | 420 | 148 | 117 | 104 | 129 | 245 | 128 | 121 | 174 | 367 |
| 2013 | 456 | 412 | 270 | 236 | 278 | 155 | 246 | 329 | 380 | 334 | 219 | 302 |
| 2014 | 268 | 291 | 329 | 299 | 317 | 305 | 277 | 295 | 178 | 285 | 271 | 412 |
| 2015 | 323 | 278 | 249 | 475 | 329 | 161 | 343 | 357 | 374 | 323 | 290 | 326 |
| 2016 | 273 | 428 | 254 | 371 | 292 | 310 | 327 | 382 | 250 | 207 | 184 | 237 |
| 2017 | 165 | 207 | 166 | 343 | 165 | 224 | 247 | 245 | 221 | 259 | 277 | 239 |
| 2018 | 295 | 302 | 294 | 204 | 270 | 225 | 148 | 248 | 235 | 216 | 216 | 244 |
| 2019 | 240 | 218 | 177 | 164 | 225 | 250 | 225 | 245 | 177 | 262 | 247 | 276 |
| 2020 | 171 | 293 | 218 | 257 | 208 | 267 | 302 | 295 | 242 | 238 | 268 | 172 |
| 2021 | 174 | 148 | 249 | 194 | 274 | 270 | 251 | 274 | 255 | 165 | 205 | 245 |
| 2022 | 300 | 275 | 287 | 351 | 277 | 374 | 225 | 252 | 182 | 260 | 241 | 199 |
| 2023 | 205 | 171 | 340 | 207 | 390 | 253 | 146 | 244 | 300 | 228 | 199 | 265 |
| 2024 | 228 | |||||||||||
| - = No Data Reported; -- = Not Applicable; NA = Not Available; W = Withheld to avoid disclosure of individual company data. |
| Release Date: 3/29/2024 |
| Next Release Date: 4/30/2024 |