|
Download Data (XLS File) |
|
||||||||
|
||||||||
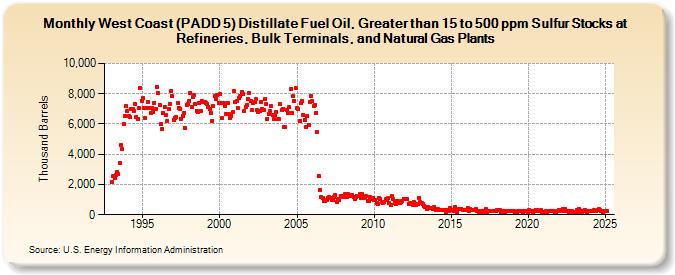
| West Coast (PADD 5) Distillate Fuel Oil, Greater than 15 to 500 ppm Sulfur Stocks at Refineries, Bulk Terminals, and Natural Gas Plants (Thousand Barrels) | ||||||||
| Year | Jan | Feb | Mar | Apr | May | Jun | Jul | Aug | Sep | Oct | Nov | Dec |
|---|---|---|---|---|---|---|---|---|---|---|---|---|
| 1993 | 2,160 | 2,568 | 2,424 | 2,612 | 2,842 | 2,705 | 3,405 | 4,619 | 4,328 | 6,002 | 6,546 | 7,162 |
| 1994 | 6,826 | 6,531 | 6,468 | 7,023 | 7,011 | 6,845 | 7,311 | 6,464 | 6,320 | 7,055 | 8,397 | 7,547 |
| 1995 | 7,743 | 7,068 | 6,397 | 7,024 | 7,451 | 7,075 | 6,733 | 7,040 | 6,796 | 7,403 | 7,013 | 8,433 |
| 1996 | 8,072 | 7,264 | 5,992 | 5,682 | 6,732 | 7,132 | 6,611 | 6,182 | 6,983 | 7,311 | 8,187 | 7,863 |
| 1997 | 6,258 | 6,379 | 6,473 | 7,391 | 7,062 | 7,001 | 6,360 | 6,510 | 6,747 | 5,763 | 7,283 | 7,321 |
| 1998 | 7,528 | 8,038 | 7,090 | 7,778 | 7,890 | 7,296 | 6,883 | 6,777 | 7,359 | 6,837 | 7,531 | 7,459 |
| 1999 | 7,430 | 7,400 | 7,347 | 7,127 | 7,008 | 6,758 | 6,228 | 7,177 | 7,858 | 7,683 | 7,930 | 7,418 |
| 2000 | 7,951 | 7,403 | 6,392 | 7,367 | 7,209 | 6,668 | 7,412 | 6,631 | 6,364 | 6,541 | 6,803 | 8,158 |
| 2001 | 7,428 | 7,489 | 7,042 | 7,698 | 7,849 | 8,107 | 7,970 | 6,859 | 7,140 | 7,276 | 7,653 | 8,049 |
| 2002 | 7,496 | 6,896 | 7,375 | 7,452 | 7,633 | 6,905 | 6,805 | 6,886 | 7,470 | 6,994 | 6,942 | 7,670 |
| 2003 | 7,347 | 6,347 | 6,675 | 6,830 | 7,210 | 6,600 | 6,326 | 6,609 | 6,776 | 6,328 | 6,303 | 7,298 |
| 2004 | 6,912 | 7,010 | 5,819 | 5,798 | 6,914 | 6,728 | 7,105 | 8,318 | 6,739 | 7,828 | 7,513 | 8,369 |
| 2005 | 7,064 | 6,963 | 6,180 | 7,355 | 7,528 | 6,609 | 6,233 | 5,823 | 6,536 | 5,957 | 7,462 | 7,817 |
| 2006 | 7,490 | 7,159 | 7,274 | 6,758 | 5,441 | 2,549 | 1,649 | 1,184 | 1,086 | 875 | 936 | 977 |
| 2007 | 1,122 | 1,160 | 1,127 | 945 | 956 | 1,190 | 1,301 | 808 | 1,009 | 1,001 | 1,251 | 1,263 |
| 2008 | 1,168 | 1,347 | 1,194 | 1,147 | 1,338 | 1,217 | 1,327 | 1,299 | 1,203 | 1,041 | 1,182 | 1,265 |
| 2009 | 1,230 | 1,366 | 1,102 | 1,360 | 1,092 | 1,201 | 1,212 | 926 | 923 | 1,170 | 1,064 | 1,122 |
| 2010 | 945 | 947 | 759 | 712 | 1,101 | 1,011 | 852 | 794 | 833 | 1,010 | 961 | 1,083 |
| 2011 | 770 | 640 | 1,225 | 1,020 | 806 | 722 | 924 | 878 | 743 | 851 | 906 | 1,063 |
| 2012 | 1,033 | 1,049 | 1,047 | 720 | 773 | 730 | 626 | 826 | 682 | 661 | 698 | 1,088 |
| 2013 | 835 | 746 | 682 | 589 | 483 | 398 | 503 | 465 | 465 | 449 | 394 | 514 |
| 2014 | 318 | 321 | 359 | 308 | 320 | 308 | 281 | 303 | 183 | 295 | 274 | 420 |
| 2015 | 329 | 282 | 252 | 484 | 338 | 166 | 348 | 366 | 383 | 332 | 298 | 338 |
| 2016 | 285 | 439 | 260 | 375 | 298 | 318 | 331 | 385 | 253 | 218 | 187 | 240 |
| 2017 | 168 | 221 | 180 | 372 | 181 | 239 | 262 | 260 | 222 | 259 | 277 | 240 |
| 2018 | 295 | 303 | 295 | 205 | 270 | 225 | 148 | 248 | 235 | 216 | 216 | 244 |
| 2019 | 240 | 218 | 177 | 170 | 225 | 250 | 226 | 245 | 177 | 262 | 247 | 276 |
| 2020 | 171 | 293 | 218 | 257 | 209 | 268 | 302 | 308 | 255 | 252 | 282 | 185 |
| 2021 | 188 | 161 | 250 | 195 | 275 | 271 | 252 | 275 | 255 | 166 | 206 | 246 |
| 2022 | 301 | 276 | 287 | 352 | 278 | 375 | 226 | 253 | 184 | 261 | 241 | 200 |
| 2023 | 205 | 172 | 341 | 208 | 390 | 254 | 148 | 245 | 302 | 229 | 200 | 265 |
| 2024 | 229 | |||||||||||
| - = No Data Reported; -- = Not Applicable; NA = Not Available; W = Withheld to avoid disclosure of individual company data. |
| Release Date: 3/29/2024 |
| Next Release Date: 4/30/2024 |