|
Download Data (XLS File) |
|
||||||||
|
||||||||
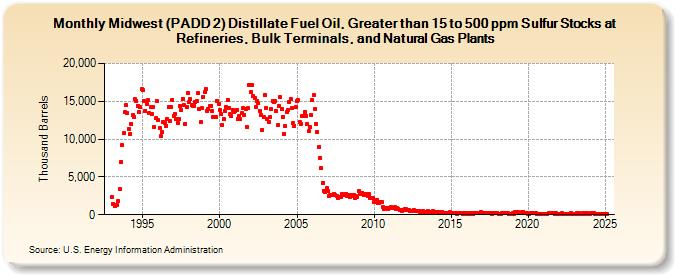
| Midwest (PADD 2) Distillate Fuel Oil, Greater than 15 to 500 ppm Sulfur Stocks at Refineries, Bulk Terminals, and Natural Gas Plants (Thousand Barrels) | ||||||||
| Year | Jan | Feb | Mar | Apr | May | Jun | Jul | Aug | Sep | Oct | Nov | Dec |
|---|---|---|---|---|---|---|---|---|---|---|---|---|
| 1993 | 2,358 | 1,392 | 1,113 | 1,231 | 1,331 | 1,801 | 3,338 | 6,963 | 9,199 | 10,812 | 13,579 | 14,470 |
| 1994 | 13,482 | 11,400 | 10,614 | 12,049 | 13,228 | 12,904 | 15,243 | 15,086 | 14,415 | 13,567 | 14,207 | 16,625 |
| 1995 | 16,454 | 14,975 | 13,757 | 14,619 | 15,172 | 13,411 | 14,193 | 13,376 | 14,236 | 11,627 | 12,744 | 14,989 |
| 1996 | 12,479 | 11,449 | 10,400 | 10,956 | 12,279 | 12,177 | 11,796 | 12,645 | 14,225 | 12,457 | 14,224 | 15,232 |
| 1997 | 13,077 | 13,367 | 12,649 | 12,137 | 12,718 | 14,437 | 13,884 | 15,310 | 14,464 | 12,031 | 14,274 | 16,063 |
| 1998 | 14,840 | 15,245 | 14,456 | 14,356 | 14,400 | 14,850 | 15,002 | 16,055 | 13,992 | 12,225 | 14,064 | 15,626 |
| 1999 | 16,226 | 16,600 | 13,687 | 13,924 | 14,365 | 14,438 | 13,747 | 12,940 | 12,887 | 12,881 | 14,992 | 14,646 |
| 2000 | 13,905 | 13,279 | 11,859 | 12,649 | 13,749 | 14,268 | 15,234 | 14,157 | 13,291 | 13,025 | 13,849 | 13,551 |
| 2001 | 13,695 | 13,836 | 12,631 | 13,101 | 12,601 | 13,396 | 14,072 | 13,131 | 13,958 | 11,607 | 14,057 | 17,138 |
| 2002 | 16,173 | 17,169 | 15,715 | 15,448 | 14,251 | 15,005 | 14,748 | 13,693 | 13,200 | 11,266 | 12,899 | 15,837 |
| 2003 | 14,152 | 12,670 | 12,287 | 12,919 | 13,916 | 15,064 | 14,913 | 15,004 | 13,708 | 11,852 | 14,355 | 15,544 |
| 2004 | 13,972 | 12,975 | 10,729 | 11,691 | 13,539 | 13,898 | 14,949 | 15,306 | 14,100 | 12,079 | 11,774 | 14,258 |
| 2005 | 15,045 | 15,121 | 12,267 | 12,051 | 13,002 | 13,112 | 13,569 | 13,108 | 11,931 | 11,024 | 11,547 | 13,121 |
| 2006 | 15,176 | 15,776 | 13,989 | 11,949 | 10,994 | 8,938 | 7,518 | 6,135 | 4,213 | 3,197 | 3,068 | 3,494 |
| 2007 | 3,168 | 2,444 | 2,560 | 2,641 | 2,588 | 2,742 | 2,624 | 2,417 | 2,276 | 2,332 | 2,378 | 2,802 |
| 2008 | 2,606 | 2,629 | 2,777 | 2,414 | 2,542 | 2,362 | 2,564 | 2,489 | 2,665 | 2,164 | 2,483 | 2,351 |
| 2009 | 3,149 | 2,688 | 2,720 | 2,875 | 2,625 | 2,680 | 2,706 | 2,499 | 2,699 | 2,270 | 2,269 | 2,227 |
| 2010 | 1,667 | 1,831 | 2,001 | 1,499 | 1,605 | 1,729 | 1,656 | 1,050 | 773 | 859 | 844 | 770 |
| 2011 | 894 | 1,020 | 902 | 908 | 972 | 818 | 911 | 805 | 679 | 654 | 512 | 681 |
| 2012 | 734 | 730 | 634 | 613 | 512 | 522 | 548 | 575 | 555 | 506 | 470 | 532 |
| 2013 | 420 | 330 | 463 | 411 | 415 | 401 | 442 | 415 | 382 | 385 | 468 | 307 |
| 2014 | 301 | 319 | 353 | 326 | 319 | 380 | 251 | 272 | 226 | 238 | 205 | 306 |
| 2015 | 238 | 231 | 179 | 192 | 178 | 108 | 241 | 179 | 204 | 158 | 196 | 262 |
| 2016 | 133 | 238 | 155 | 178 | 180 | 102 | 208 | 234 | 233 | 189 | 280 | 314 |
| 2017 | 205 | 165 | 187 | 214 | 244 | 181 | 174 | 200 | 132 | 171 | 183 | 211 |
| 2018 | 169 | 116 | 135 | 110 | 177 | 212 | 220 | 197 | 175 | 159 | 152 | 129 |
| 2019 | 192 | 147 | 321 | 296 | 358 | 258 | 265 | 293 | 372 | 198 | 192 | 175 |
| 2020 | 99 | 152 | 180 | 181 | 178 | 161 | 164 | 135 | 112 | 54 | 115 | 126 |
| 2021 | 87 | 89 | 117 | 134 | 186 | 232 | 263 | 219 | 238 | 142 | 187 | 109 |
| 2022 | 122 | 88 | 164 | 116 | 125 | 133 | 73 | 155 | 107 | 203 | 156 | 152 |
| 2023 | 154 | 122 | 174 | 84 | 186 | 92 | 85 | 161 | 111 | 212 | 203 | 130 |
| 2024 | 139 | |||||||||||
| - = No Data Reported; -- = Not Applicable; NA = Not Available; W = Withheld to avoid disclosure of individual company data. |
| Release Date: 3/29/2024 |
| Next Release Date: 4/30/2024 |