|
Download Data (XLS File) |
|
||||||||
|
||||||||
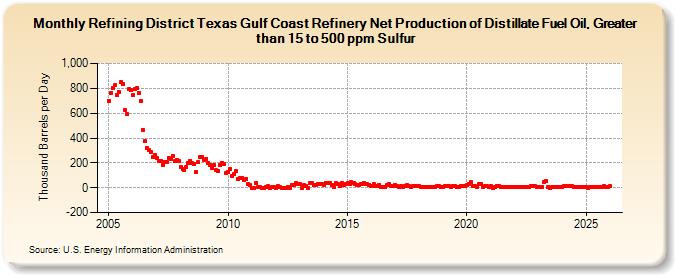
| Refining District Texas Gulf Coast Refinery Net Production of Distillate Fuel Oil, Greater than 15 to 500 ppm Sulfur (Thousand Barrels per Day) | ||||||||
| Year | Jan | Feb | Mar | Apr | May | Jun | Jul | Aug | Sep | Oct | Nov | Dec |
|---|---|---|---|---|---|---|---|---|---|---|---|---|
| 2005 | 698 | 764 | 806 | 825 | 747 | 773 | 850 | 837 | 623 | 592 | 792 | 786 |
| 2006 | 746 | 791 | 800 | 763 | 697 | 467 | 373 | 318 | 305 | 289 | 245 | 262 |
| 2007 | 236 | 218 | 216 | 182 | 210 | 206 | 241 | 235 | 254 | 213 | 223 | 215 |
| 2008 | 168 | 152 | 143 | 168 | 198 | 219 | 200 | 188 | 124 | 206 | 244 | 245 |
| 2009 | 223 | 235 | 201 | 182 | 158 | 179 | 139 | 138 | 180 | 201 | 193 | 119 |
| 2010 | 127 | 149 | 96 | 112 | 136 | 74 | 82 | 78 | 64 | 73 | 28 | 20 |
| 2011 | 1 | 0 | 40 | 2 | 5 | 1 | -1 | 3 | 10 | 1 | 2 | 7 |
| 2012 | 0 | 10 | 2 | 1 | -5 | -1 | 3 | -5 | 21 | 24 | 34 | 33 |
| 2013 | 29 | -5 | 18 | 11 | 1 | 34 | 35 | 23 | 21 | 27 | 32 | 30 |
| 2014 | 25 | 36 | 40 | 38 | 23 | 9 | 34 | 29 | 10 | 34 | 20 | 30 |
| 2015 | 36 | 28 | 42 | 41 | 27 | 20 | 20 | 27 | 37 | 33 | 27 | 24 |
| 2016 | 17 | 27 | 10 | 12 | 22 | 4 | 7 | 8 | 21 | 27 | 15 | 17 |
| 2017 | 20 | 10 | 6 | 14 | 8 | 10 | 18 | 12 | 8 | 12 | 10 | 11 |
| 2018 | 10 | 8 | 9 | 9 | 9 | 8 | 7 | 7 | 9 | 10 | 11 | 9 |
| 2019 | 7 | 10 | 10 | 11 | 9 | 11 | 10 | 9 | 7 | 12 | 11 | 17 |
| 2020 | 22 | 26 | 43 | 13 | 10 | 9 | 26 | 29 | 3 | 10 | 10 | 7 |
| 2021 | 10 | -1 | 8 | 15 | 10 | 8 | 8 | 7 | 9 | 8 | 7 | 7 |
| 2022 | 5 | 8 | 7 | 9 | 9 | 8 | 9 | 9 | 10 | 10 | 11 | 7 |
| 2023 | 7 | 7 | 9 | 42 | 53 | 9 | -1 | 8 | 9 | 9 | 8 | 9 |
| 2024 | 9 | 11 | 11 | 10 | 10 | 10 | ||||||
| - = No Data Reported; -- = Not Applicable; NA = Not Available; W = Withheld to avoid disclosure of individual company data. |
| Release Date: 8/30/2024 |
| Next Release Date: 9/30/2024 |