|
Download Data (XLS File) |
|
||||||||
|
||||||||
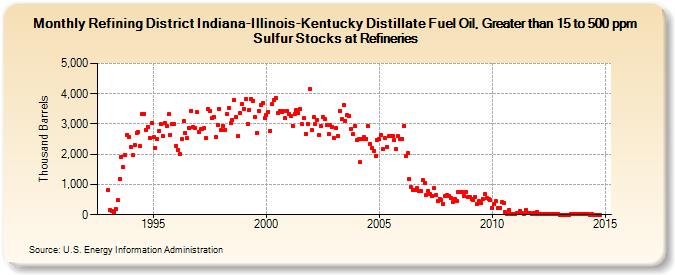
| Refining District Indiana-Illinois-Kentucky Distillate Fuel Oil, Greater than 15 to 500 ppm Sulfur Stocks at Refineries (Thousand Barrels) | ||||||||
| Year | Jan | Feb | Mar | Apr | May | Jun | Jul | Aug | Sep | Oct | Nov | Dec |
|---|---|---|---|---|---|---|---|---|---|---|---|---|
| 1993 | 815 | 151 | 130 | 100 | 184 | 478 | 1,173 | 1,922 | 1,565 | 1,983 | 2,647 | 2,582 |
| 1994 | 2,238 | 1,965 | 2,297 | 2,714 | 2,723 | 2,267 | 3,320 | 3,334 | 2,807 | 2,911 | 2,538 | 3,031 |
| 1995 | 2,557 | 2,221 | 2,498 | 2,784 | 2,988 | 2,596 | 3,034 | 2,940 | 3,320 | 2,650 | 3,004 | 3,001 |
| 1996 | 2,286 | 2,155 | 1,992 | 2,502 | 3,088 | 2,703 | 2,526 | 2,874 | 3,442 | 2,909 | 2,867 | 3,404 |
| 1997 | 2,741 | 2,821 | 2,829 | 2,864 | 2,543 | 3,497 | 3,438 | 3,197 | 3,243 | 2,567 | 2,981 | 3,503 |
| 1998 | 2,787 | 2,941 | 2,809 | 3,324 | 3,543 | 3,030 | 3,128 | 3,796 | 3,225 | 2,614 | 3,366 | 3,664 |
| 1999 | 3,487 | 3,833 | 3,014 | 3,478 | 3,827 | 3,775 | 3,215 | 2,711 | 3,426 | 3,634 | 3,701 | 3,193 |
| 2000 | 3,301 | 3,399 | 2,779 | 3,647 | 3,802 | 3,867 | 3,350 | 3,426 | 3,381 | 3,425 | 3,185 | 3,434 |
| 2001 | 3,334 | 3,251 | 2,945 | 3,337 | 3,470 | 3,355 | 3,488 | 2,998 | 3,185 | 2,674 | 3,004 | 4,162 |
| 2002 | 2,812 | 3,224 | 3,004 | 3,141 | 2,634 | 2,918 | 3,236 | 3,152 | 2,973 | 2,676 | 2,980 | 2,915 |
| 2003 | 2,533 | 2,860 | 2,613 | 3,439 | 3,155 | 3,634 | 3,102 | 3,296 | 3,279 | 2,835 | 2,666 | 2,933 |
| 2004 | 2,454 | 2,490 | 1,729 | 2,487 | 2,572 | 2,518 | 2,933 | 2,330 | 2,196 | 2,115 | 1,933 | 2,484 |
| 2005 | 2,490 | 2,641 | 2,157 | 2,530 | 2,247 | 2,588 | 2,602 | 2,595 | 2,482 | 2,169 | 2,590 | 2,512 |
| 2006 | 2,517 | 2,936 | 1,930 | 2,047 | 1,185 | 901 | 820 | 815 | 874 | 776 | 799 | 1,133 |
| 2007 | 1,056 | 644 | 800 | 669 | 618 | 872 | 638 | 445 | 534 | 490 | 369 | 620 |
| 2008 | 638 | 624 | 566 | 406 | 521 | 464 | 741 | 758 | 759 | 626 | 755 | 584 |
| 2009 | 584 | 514 | 494 | 596 | 361 | 439 | 396 | 508 | 677 | 559 | 512 | 480 |
| 2010 | 227 | 368 | 444 | 207 | 232 | 417 | 402 | 80 | 21 | 159 | 26 | 16 |
| 2011 | 34 | 43 | 50 | 130 | 45 | 13 | 160 | 45 | 48 | 33 | 49 | 27 |
| 2012 | 94 | 27 | 15 | 15 | 16 | 12 | 12 | 12 | 13 | 13 | 13 | 13 |
| 2013 | 5 | 7 | 7 | 7 | 7 | 7 | 12 | 10 | 9 | 12 | 8 | 9 |
| 2014 | 10 | 8 | 10 | 9 | 7 | 9 | 7 | 7 | 7 | 6 | ||
| - = No Data Reported; -- = Not Applicable; NA = Not Available; W = Withheld to avoid disclosure of individual company data. |
| Release Date: 3/29/2024 |
| Next Release Date: 4/30/2024 |