|
Download Data (XLS File) |
|
||||||||
|
||||||||
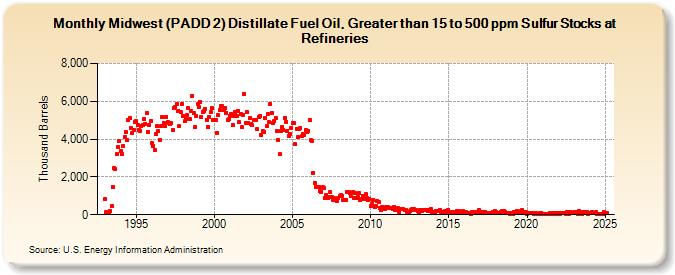
| Midwest (PADD 2) Distillate Fuel Oil, Greater than 15 to 500 ppm Sulfur Stocks at Refineries (Thousand Barrels) | ||||||||
| Year | Jan | Feb | Mar | Apr | May | Jun | Jul | Aug | Sep | Oct | Nov | Dec |
|---|---|---|---|---|---|---|---|---|---|---|---|---|
| 1993 | 828 | 161 | 132 | 104 | 197 | 487 | 1,490 | 2,448 | 2,428 | 3,199 | 3,589 | 3,889 |
| 1994 | 3,373 | 3,221 | 3,648 | 4,114 | 4,386 | 3,950 | 5,019 | 5,126 | 4,564 | 4,320 | 4,468 | 4,909 |
| 1995 | 4,944 | 4,762 | 4,486 | 4,437 | 4,718 | 4,747 | 5,060 | 4,806 | 5,393 | 4,371 | 4,768 | 4,946 |
| 1996 | 3,787 | 3,627 | 3,434 | 4,249 | 4,675 | 4,412 | 3,959 | 4,703 | 5,186 | 4,856 | 4,688 | 5,194 |
| 1997 | 4,898 | 4,861 | 4,815 | 4,850 | 4,475 | 5,667 | 5,686 | 5,839 | 5,491 | 4,677 | 5,435 | 5,867 |
| 1998 | 5,245 | 4,936 | 5,073 | 5,251 | 5,632 | 5,076 | 5,469 | 6,281 | 5,391 | 4,643 | 5,233 | 5,832 |
| 1999 | 5,678 | 5,968 | 5,179 | 5,448 | 5,512 | 5,599 | 5,012 | 4,616 | 5,161 | 5,407 | 5,637 | 5,001 |
| 2000 | 5,020 | 5,015 | 4,342 | 5,274 | 5,550 | 5,764 | 5,736 | 5,523 | 5,658 | 5,396 | 4,997 | 5,050 |
| 2001 | 5,242 | 5,349 | 4,747 | 5,229 | 5,435 | 5,246 | 5,490 | 4,891 | 5,303 | 4,624 | 5,289 | 6,381 |
| 2002 | 4,861 | 5,415 | 4,847 | 5,090 | 4,817 | 4,722 | 5,012 | 4,997 | 5,027 | 4,508 | 5,160 | 5,203 |
| 2003 | 4,227 | 4,420 | 4,367 | 5,133 | 4,694 | 5,336 | 4,891 | 5,864 | 5,399 | 4,832 | 4,960 | 5,103 |
| 2004 | 4,435 | 3,949 | 3,205 | 4,413 | 4,646 | 4,484 | 5,112 | 4,924 | 4,446 | 4,164 | 4,245 | 4,586 |
| 2005 | 4,863 | 4,841 | 3,729 | 4,550 | 4,085 | 4,526 | 4,595 | 4,143 | 4,269 | 4,210 | 4,490 | 4,356 |
| 2006 | 4,451 | 5,030 | 3,931 | 3,898 | 2,221 | 1,673 | 1,452 | 1,475 | 1,470 | 1,253 | 1,207 | 1,443 |
| 2007 | 1,398 | 870 | 1,030 | 885 | 930 | 1,193 | 915 | 784 | 859 | 788 | 750 | 898 |
| 2008 | 970 | 1,051 | 1,003 | 757 | 762 | 771 | 1,178 | 1,192 | 1,152 | 991 | 1,178 | 902 |
| 2009 | 1,127 | 862 | 935 | 1,147 | 765 | 806 | 1,014 | 832 | 1,081 | 897 | 791 | 843 |
| 2010 | 457 | 560 | 780 | 409 | 480 | 745 | 680 | 351 | 249 | 434 | 336 | 277 |
| 2011 | 418 | 405 | 350 | 380 | 365 | 297 | 432 | 275 | 282 | 333 | 155 | 310 |
| 2012 | 305 | 295 | 256 | 262 | 153 | 151 | 181 | 249 | 327 | 323 | 261 | 246 |
| 2013 | 171 | 162 | 260 | 216 | 239 | 258 | 273 | 230 | 184 | 264 | 317 | 127 |
| 2014 | 148 | 163 | 204 | 190 | 204 | 255 | 113 | 132 | 124 | 175 | 133 | 234 |
| 2015 | 150 | 136 | 127 | 109 | 132 | 76 | 202 | 150 | 174 | 134 | 165 | 176 |
| 2016 | 84 | 134 | 72 | 87 | 99 | 48 | 132 | 119 | 141 | 123 | 169 | 223 |
| 2017 | 154 | 118 | 145 | 120 | 152 | 84 | 86 | 115 | 80 | 88 | 136 | 193 |
| 2018 | 163 | 110 | 117 | 91 | 155 | 182 | 190 | 144 | 108 | 97 | 93 | 51 |
| 2019 | 88 | 44 | 165 | 160 | 215 | 105 | 103 | 184 | 238 | 91 | 123 | 142 |
| 2020 | 59 | 75 | 86 | 103 | 95 | 57 | 89 | 65 | 47 | 30 | 90 | 102 |
| 2021 | 29 | 37 | 26 | 47 | 60 | 57 | 100 | 58 | 95 | 27 | 93 | 50 |
| 2022 | 74 | 37 | 111 | 91 | 71 | 107 | 48 | 131 | 63 | 145 | 109 | 103 |
| 2023 | 132 | 67 | 153 | 58 | 172 | 66 | 29 | 145 | 72 | 149 | 148 | 51 |
| 2024 | 73 | |||||||||||
| - = No Data Reported; -- = Not Applicable; NA = Not Available; W = Withheld to avoid disclosure of individual company data. |
| Release Date: 3/29/2024 |
| Next Release Date: 4/30/2024 |