|
Download Data (XLS File) |
|
||||||||
|
||||||||
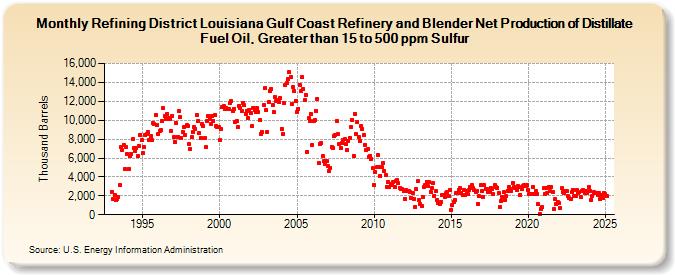
| Refining District Louisiana Gulf Coast Refinery and Blender Net Production of Distillate Fuel Oil, Greater than 15 to 500 ppm Sulfur (Thousand Barrels) | ||||||||
| Year | Jan | Feb | Mar | Apr | May | Jun | Jul | Aug | Sep | Oct | Nov | Dec |
|---|---|---|---|---|---|---|---|---|---|---|---|---|
| 1993 | 2,453 | 1,680 | 2,033 | 1,541 | 1,614 | 1,892 | 3,102 | 7,133 | 6,798 | 7,409 | 4,873 | 7,190 |
| 1994 | 6,436 | 4,880 | 6,160 | 6,442 | 7,963 | 7,030 | 6,748 | 7,081 | 6,228 | 7,275 | 8,462 | 7,855 |
| 1995 | 6,525 | 7,156 | 8,382 | 8,534 | 8,726 | 7,949 | 8,368 | 7,861 | 9,662 | 9,590 | 10,561 | 9,487 |
| 1996 | 8,534 | 8,837 | 8,954 | 9,966 | 11,248 | 10,437 | 10,075 | 10,665 | 10,239 | 10,128 | 8,863 | 10,454 |
| 1997 | 8,179 | 7,737 | 9,700 | 8,262 | 10,936 | 10,382 | 8,142 | 8,777 | 9,302 | 8,411 | 9,450 | 9,411 |
| 1998 | 7,476 | 6,950 | 8,177 | 8,704 | 9,290 | 9,071 | 10,573 | 9,943 | 8,611 | 8,145 | 9,591 | 9,395 |
| 1999 | 8,106 | 7,143 | 9,949 | 10,460 | 10,091 | 9,618 | 10,478 | 9,965 | 10,589 | 9,377 | 9,316 | 9,303 |
| 2000 | 7,934 | 9,042 | 11,354 | 11,453 | 11,168 | 11,311 | 11,193 | 11,134 | 11,852 | 11,979 | 10,996 | 11,212 |
| 2001 | 9,847 | 9,942 | 9,234 | 11,552 | 11,295 | 10,983 | 11,838 | 11,574 | 10,660 | 10,995 | 10,238 | 11,121 |
| 2002 | 10,782 | 9,381 | 11,342 | 11,041 | 10,878 | 11,261 | 10,847 | 9,987 | 8,566 | 8,776 | 11,624 | 13,401 |
| 2003 | 11,031 | 8,797 | 11,935 | 13,126 | 13,339 | 11,622 | 10,865 | 12,438 | 12,041 | 12,121 | 11,872 | 12,324 |
| 2004 | 9,110 | 8,529 | 11,828 | 13,721 | 13,928 | 14,316 | 15,050 | 14,588 | 11,739 | 13,495 | 13,077 | 12,064 |
| 2005 | 10,888 | 11,236 | 13,741 | 13,054 | 14,586 | 13,300 | 12,103 | 12,649 | 6,651 | 10,183 | 9,960 | 10,648 |
| 2006 | 7,373 | 9,864 | 10,017 | 11,021 | 12,268 | 5,458 | 7,513 | 7,546 | 6,222 | 5,667 | 5,383 | 5,648 |
| 2007 | 5,201 | 4,623 | 4,992 | 7,183 | 7,043 | 8,312 | 8,422 | 9,922 | 8,488 | 7,464 | 7,015 | 7,538 |
| 2008 | 7,914 | 7,960 | 7,467 | 6,861 | 7,817 | 8,143 | 9,235 | 10,040 | 6,242 | 10,657 | 8,489 | 9,855 |
| 2009 | 8,254 | 7,787 | 9,363 | 9,072 | 8,406 | 7,416 | 6,811 | 6,917 | 6,140 | 6,245 | 5,932 | 4,895 |
| 2010 | 3,146 | 4,519 | 5,016 | 6,327 | 5,076 | 4,136 | 5,007 | 5,435 | 4,626 | 4,150 | 2,985 | 3,421 |
| 2011 | 2,932 | 3,204 | 3,186 | 3,415 | 2,885 | 3,531 | 3,627 | 3,318 | 2,830 | 2,730 | 2,673 | 2,480 |
| 2012 | 1,712 | 2,622 | 2,493 | 2,528 | 2,445 | 1,787 | 2,348 | 1,650 | 834 | 2,672 | 3,518 | 1,576 |
| 2013 | 1,100 | 969 | 1,908 | 2,957 | 3,194 | 3,509 | 2,998 | 3,451 | 2,412 | 2,847 | 3,345 | 2,007 |
| 2014 | 2,488 | 1,569 | 1,271 | 1,165 | 1,369 | 2,035 | 2,050 | 1,894 | 2,264 | 2,404 | 1,936 | 2,644 |
| 2015 | 551 | 1,020 | 1,347 | 1,574 | 2,307 | 2,306 | 2,634 | 2,821 | 2,337 | 2,073 | 2,655 | 2,054 |
| 2016 | 2,488 | 2,157 | 2,624 | 2,918 | 3,110 | 2,867 | 2,612 | 2,368 | 2,546 | 1,145 | 1,947 | 3,106 |
| 2017 | 2,499 | 1,908 | 3,116 | 2,722 | 2,723 | 2,422 | 2,365 | 2,817 | 2,755 | 2,149 | 3,110 | 2,949 |
| 2018 | 2,861 | 2,323 | 791 | 1,486 | 1,926 | 2,353 | 1,592 | 1,951 | 2,523 | 2,971 | 2,752 | 2,517 |
| 2019 | 3,392 | 2,890 | 2,805 | 2,600 | 2,995 | 2,936 | 2,108 | 2,714 | 3,029 | 3,126 | 2,998 | 3,113 |
| 2020 | 2,666 | 2,239 | 2,238 | 2,229 | 2,911 | 2,229 | 2,505 | 2,241 | 1,159 | 115 | 600 | 772 |
| 2021 | 2,789 | 2,187 | 2,804 | 2,252 | 2,906 | 2,467 | 2,901 | 2,434 | 557 | 1,625 | 1,093 | 1,313 |
| 2022 | 1,224 | 715 | 2,777 | 2,381 | 2,336 | 2,542 | 2,504 | 1,958 | 1,721 | 1,646 | 2,351 | 2,664 |
| 2023 | 2,021 | 1,973 | 2,667 | 2,277 | 2,374 | 1,898 | 2,528 | 2,621 | 2,253 | 2,545 | 2,306 | 2,916 |
| 2024 | 2,549 | 1,587 | 1,982 | 2,373 | ||||||||
| - = No Data Reported; -- = Not Applicable; NA = Not Available; W = Withheld to avoid disclosure of individual company data. |
| Release Date: 6/28/2024 |
| Next Release Date: 7/31/2024 |