|
Download Data (XLS File) |
|
||||||||
|
||||||||
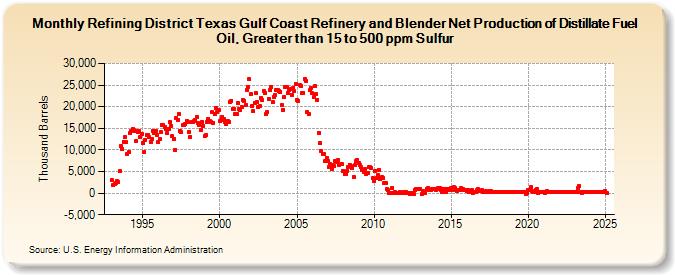
| Refining District Texas Gulf Coast Refinery and Blender Net Production of Distillate Fuel Oil, Greater than 15 to 500 ppm Sulfur (Thousand Barrels) | ||||||||
| Year | Jan | Feb | Mar | Apr | May | Jun | Jul | Aug | Sep | Oct | Nov | Dec |
|---|---|---|---|---|---|---|---|---|---|---|---|---|
| 1993 | 2,938 | 1,881 | 2,222 | 2,291 | 2,752 | 2,626 | 5,045 | 10,855 | 10,316 | 11,920 | 12,959 | 11,770 |
| 1994 | 9,146 | 9,454 | 13,797 | 14,417 | 14,893 | 14,538 | 14,477 | 12,164 | 14,067 | 14,482 | 12,914 | 13,593 |
| 1995 | 11,662 | 9,593 | 12,351 | 13,479 | 13,445 | 13,026 | 11,919 | 12,600 | 14,478 | 13,840 | 14,460 | 13,473 |
| 1996 | 11,717 | 12,450 | 14,054 | 15,770 | 15,815 | 15,381 | 14,778 | 13,979 | 14,911 | 16,369 | 15,622 | 13,183 |
| 1997 | 12,478 | 10,036 | 17,489 | 16,990 | 18,196 | 14,388 | 14,199 | 15,680 | 15,760 | 16,089 | 16,657 | 16,443 |
| 1998 | 14,225 | 13,091 | 16,427 | 16,352 | 16,769 | 16,861 | 17,688 | 16,221 | 15,760 | 14,660 | 16,558 | 15,535 |
| 1999 | 13,155 | 13,402 | 16,396 | 17,229 | 16,608 | 16,526 | 18,689 | 16,292 | 18,195 | 19,808 | 18,751 | 19,171 |
| 2000 | 16,590 | 17,034 | 17,646 | 17,051 | 16,556 | 15,906 | 16,738 | 16,541 | 21,176 | 21,389 | 19,574 | 19,528 |
| 2001 | 18,201 | 18,283 | 20,966 | 19,423 | 19,171 | 19,922 | 21,513 | 21,367 | 20,452 | 23,883 | 24,663 | 26,325 |
| 2002 | 22,914 | 20,263 | 18,946 | 20,905 | 23,084 | 21,137 | 19,945 | 20,094 | 22,003 | 21,562 | 23,540 | 23,118 |
| 2003 | 18,310 | 18,768 | 21,797 | 23,794 | 24,629 | 20,997 | 22,330 | 22,747 | 23,889 | 23,917 | 23,720 | 23,453 |
| 2004 | 20,290 | 19,275 | 22,168 | 24,450 | 24,488 | 23,268 | 23,936 | 24,143 | 22,769 | 24,415 | 23,568 | 25,153 |
| 2005 | 21,636 | 21,394 | 24,985 | 24,761 | 23,144 | 23,175 | 26,338 | 25,959 | 18,680 | 18,352 | 23,769 | 24,375 |
| 2006 | 23,130 | 22,156 | 24,794 | 22,891 | 21,609 | 14,017 | 11,573 | 9,856 | 9,143 | 8,951 | 7,353 | 8,119 |
| 2007 | 7,331 | 6,117 | 6,689 | 5,474 | 6,520 | 6,172 | 7,484 | 7,274 | 7,609 | 6,591 | 6,684 | 6,676 |
| 2008 | 5,193 | 4,419 | 4,446 | 5,032 | 6,123 | 6,579 | 6,205 | 5,823 | 3,722 | 6,398 | 7,328 | 7,608 |
| 2009 | 6,917 | 6,421 | 5,927 | 5,462 | 4,943 | 5,569 | 4,336 | 4,640 | 5,952 | 5,976 | 5,779 | 3,420 |
| 2010 | 2,723 | 5,213 | 3,551 | 4,164 | 5,378 | 3,198 | 3,645 | 3,523 | 2,415 | 2,381 | 890 | 653 |
| 2011 | -10 | 39 | 1,272 | 85 | 197 | 35 | -28 | 85 | 294 | 84 | 55 | 217 |
| 2012 | 15 | 294 | 55 | 33 | -164 | -34 | 88 | -159 | 618 | 888 | 1,006 | 1,037 |
| 2013 | 899 | -151 | 559 | 322 | 40 | 1,015 | 1,081 | 713 | 616 | 847 | 969 | 936 |
| 2014 | 779 | 1,007 | 1,240 | 1,133 | 715 | 275 | 1,044 | 914 | 305 | 1,060 | 610 | 940 |
| 2015 | 1,106 | 785 | 1,316 | 1,239 | 833 | 603 | 624 | 831 | 1,104 | 1,034 | 825 | 754 |
| 2016 | 525 | 798 | 323 | 355 | 704 | 135 | 246 | 274 | 654 | 856 | 452 | 516 |
| 2017 | 610 | 277 | 174 | 407 | 239 | 305 | 551 | 378 | 236 | 364 | 296 | 328 |
| 2018 | 301 | 216 | 272 | 277 | 281 | 252 | 226 | 207 | 256 | 321 | 326 | 282 |
| 2019 | 229 | 286 | 325 | 331 | 270 | 323 | 306 | 294 | 216 | 368 | -103 | 81 |
| 2020 | 688 | 702 | 1,338 | 381 | 296 | 263 | 802 | 892 | 103 | 298 | 287 | 228 |
| 2021 | 315 | -24 | 237 | 459 | 305 | 226 | 246 | 223 | 264 | 237 | 206 | 217 |
| 2022 | 161 | 222 | 220 | 268 | 265 | 249 | 286 | 292 | 314 | 319 | 315 | 218 |
| 2023 | 217 | 198 | 291 | 1,268 | 1,636 | 267 | -19 | 247 | 269 | 268 | 253 | 278 |
| 2024 | 265 | 324 | 327 | 286 | ||||||||
| - = No Data Reported; -- = Not Applicable; NA = Not Available; W = Withheld to avoid disclosure of individual company data. |
| Release Date: 6/28/2024 |
| Next Release Date: 7/31/2024 |