|
Download Data (XLS File) |
|
||||||||
|
||||||||
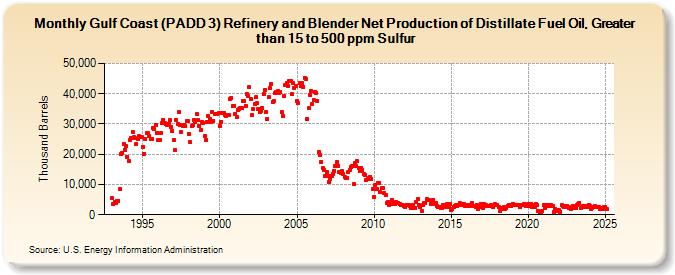
| Gulf Coast (PADD 3) Refinery and Blender Net Production of Distillate Fuel Oil, Greater than 15 to 500 ppm Sulfur (Thousand Barrels) | ||||||||
| Year | Jan | Feb | Mar | Apr | May | Jun | Jul | Aug | Sep | Oct | Nov | Dec |
|---|---|---|---|---|---|---|---|---|---|---|---|---|
| 1993 | 5,463 | 3,667 | 4,356 | 3,950 | 4,457 | 4,624 | 8,419 | 20,030 | 20,346 | 23,347 | 21,461 | 22,642 |
| 1994 | 19,236 | 17,762 | 24,643 | 25,383 | 27,347 | 25,598 | 25,283 | 23,480 | 25,027 | 25,876 | 25,657 | 25,783 |
| 1995 | 22,538 | 20,211 | 24,995 | 27,003 | 26,916 | 25,875 | 24,899 | 25,096 | 28,693 | 28,257 | 29,592 | 27,126 |
| 1996 | 24,574 | 24,764 | 26,950 | 30,395 | 31,476 | 30,482 | 29,859 | 29,775 | 29,860 | 31,169 | 29,059 | 27,823 |
| 1997 | 24,633 | 21,329 | 31,449 | 30,135 | 34,072 | 29,809 | 27,350 | 29,459 | 29,523 | 29,233 | 31,026 | 30,871 |
| 1998 | 26,654 | 24,035 | 29,309 | 29,626 | 31,284 | 30,750 | 33,265 | 31,178 | 29,468 | 27,920 | 30,737 | 30,166 |
| 1999 | 25,952 | 24,588 | 30,757 | 32,741 | 31,653 | 30,592 | 33,968 | 31,043 | 33,456 | 33,364 | 33,318 | 33,550 |
| 2000 | 29,283 | 30,797 | 33,661 | 33,628 | 33,113 | 32,504 | 33,080 | 32,933 | 38,319 | 38,644 | 35,780 | 36,099 |
| 2001 | 33,418 | 32,366 | 34,713 | 34,797 | 35,255 | 35,266 | 37,567 | 37,674 | 36,056 | 39,877 | 39,326 | 42,209 |
| 2002 | 38,159 | 32,926 | 34,917 | 36,440 | 38,832 | 36,805 | 35,094 | 33,912 | 34,413 | 35,337 | 40,038 | 41,201 |
| 2003 | 33,915 | 31,645 | 38,972 | 41,820 | 43,277 | 37,197 | 37,750 | 40,244 | 40,632 | 40,780 | 40,194 | 40,605 |
| 2004 | 33,977 | 32,616 | 39,124 | 42,887 | 43,550 | 42,695 | 44,109 | 44,111 | 39,803 | 43,491 | 41,987 | 42,679 |
| 2005 | 37,466 | 36,777 | 43,664 | 42,535 | 43,464 | 42,361 | 45,167 | 44,965 | 31,615 | 35,160 | 39,705 | 41,008 |
| 2006 | 36,468 | 37,916 | 40,540 | 40,361 | 37,578 | 20,692 | 19,848 | 17,571 | 15,533 | 14,823 | 12,884 | 13,962 |
| 2007 | 12,713 | 10,893 | 11,835 | 12,901 | 13,582 | 14,614 | 16,080 | 17,325 | 16,254 | 14,239 | 13,882 | 14,394 |
| 2008 | 13,369 | 12,541 | 12,088 | 12,073 | 14,095 | 14,858 | 15,687 | 16,013 | 10,104 | 17,188 | 15,963 | 17,618 |
| 2009 | 15,284 | 14,323 | 15,493 | 14,718 | 13,550 | 13,223 | 11,386 | 11,689 | 12,275 | 12,527 | 11,862 | 8,339 |
| 2010 | 5,919 | 9,910 | 8,589 | 10,505 | 10,503 | 7,364 | 8,756 | 8,982 | 7,104 | 6,610 | 3,831 | 4,217 |
| 2011 | 3,220 | 3,381 | 4,999 | 3,918 | 3,554 | 4,097 | 3,973 | 3,871 | 3,571 | 3,228 | 3,312 | 3,039 |
| 2012 | 2,610 | 3,363 | 3,090 | 3,148 | 2,907 | 2,268 | 3,135 | 2,083 | 2,148 | 4,260 | 5,139 | 3,303 |
| 2013 | 2,614 | 1,085 | 3,080 | 3,954 | 3,922 | 5,140 | 4,718 | 4,759 | 3,612 | 4,239 | 4,946 | 3,552 |
| 2014 | 3,826 | 2,753 | 2,614 | 2,479 | 2,202 | 2,379 | 3,142 | 2,873 | 2,584 | 3,505 | 2,565 | 3,633 |
| 2015 | 1,679 | 1,835 | 2,702 | 2,969 | 3,078 | 2,966 | 3,282 | 3,729 | 3,497 | 3,124 | 3,524 | 2,836 |
| 2016 | 3,064 | 2,997 | 3,019 | 3,295 | 3,876 | 3,018 | 2,880 | 2,677 | 3,203 | 2,048 | 2,453 | 3,621 |
| 2017 | 3,139 | 2,230 | 3,382 | 3,151 | 2,996 | 2,778 | 2,959 | 3,247 | 3,001 | 2,579 | 3,406 | 3,366 |
| 2018 | 3,151 | 2,572 | 1,085 | 1,840 | 2,231 | 2,649 | 1,886 | 2,229 | 2,798 | 3,355 | 3,225 | 2,931 |
| 2019 | 3,697 | 3,310 | 3,238 | 3,049 | 3,355 | 3,375 | 2,513 | 3,199 | 3,330 | 3,508 | 3,010 | 3,311 |
| 2020 | 3,380 | 2,968 | 3,650 | 2,648 | 3,235 | 2,526 | 3,390 | 3,115 | 1,289 | 455 | 905 | 1,100 |
| 2021 | 3,198 | 2,245 | 3,101 | 2,841 | 3,301 | 2,747 | 3,290 | 2,823 | 914 | 1,967 | 1,354 | 1,612 |
| 2022 | 1,482 | 1,010 | 3,070 | 2,762 | 2,634 | 2,875 | 2,922 | 2,469 | 2,093 | 1,956 | 2,673 | 2,880 |
| 2023 | 2,327 | 2,243 | 3,072 | 3,691 | 4,005 | 2,270 | 2,490 | 2,962 | 2,539 | 2,820 | 2,652 | 3,276 |
| 2024 | 2,863 | |||||||||||
| - = No Data Reported; -- = Not Applicable; NA = Not Available; W = Withheld to avoid disclosure of individual company data. |
| Release Date: 3/29/2024 |
| Next Release Date: 4/30/2024 |