|
Download Data (XLS File) |
|
||||||||
|
||||||||
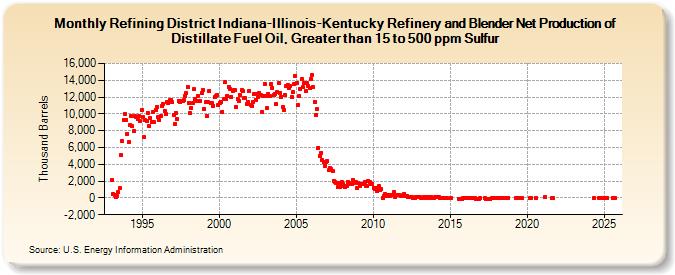
| Refining District Indiana-Illinois-Kentucky Refinery and Blender Net Production of Distillate Fuel Oil, Greater than 15 to 500 ppm Sulfur (Thousand Barrels) | ||||||||
| Year | Jan | Feb | Mar | Apr | May | Jun | Jul | Aug | Sep | Oct | Nov | Dec |
|---|---|---|---|---|---|---|---|---|---|---|---|---|
| 1993 | 2,167 | 465 | 401 | 69 | 192 | 693 | 1,173 | 5,065 | 6,750 | 9,293 | 10,016 | 9,321 |
| 1994 | 7,666 | 6,677 | 8,660 | 9,800 | 8,537 | 7,918 | 9,699 | 9,596 | 9,359 | 9,709 | 9,129 | 10,458 |
| 1995 | 9,635 | 7,264 | 9,230 | 9,167 | 10,162 | 8,515 | 9,504 | 9,045 | 10,196 | 9,005 | 10,485 | 10,811 |
| 1996 | 9,618 | 9,230 | 9,702 | 10,985 | 11,119 | 10,379 | 9,997 | 11,441 | 11,239 | 11,604 | 11,661 | 11,395 |
| 1997 | 9,820 | 8,846 | 10,142 | 9,376 | 11,593 | 11,402 | 11,485 | 11,545 | 11,619 | 12,177 | 12,442 | 13,259 |
| 1998 | 11,353 | 10,090 | 10,707 | 11,279 | 12,937 | 11,825 | 11,509 | 12,146 | 11,501 | 11,568 | 12,434 | 12,835 |
| 1999 | 10,639 | 11,399 | 9,808 | 11,385 | 12,706 | 11,264 | 11,274 | 10,985 | 11,990 | 12,096 | 12,276 | 11,046 |
| 2000 | 11,342 | 11,366 | 10,242 | 11,717 | 13,762 | 11,734 | 12,136 | 13,214 | 13,008 | 12,067 | 12,747 | 12,869 |
| 2001 | 12,812 | 10,827 | 11,794 | 11,562 | 12,245 | 12,837 | 12,709 | 11,862 | 11,869 | 11,202 | 11,453 | 12,718 |
| 2002 | 11,108 | 10,976 | 11,452 | 12,333 | 11,689 | 12,318 | 12,023 | 12,512 | 12,214 | 10,227 | 12,144 | 13,601 |
| 2003 | 12,128 | 10,673 | 12,401 | 12,155 | 13,585 | 13,128 | 12,233 | 12,416 | 11,194 | 12,555 | 13,656 | 12,502 |
| 2004 | 12,060 | 10,807 | 10,510 | 12,294 | 13,302 | 13,443 | 13,033 | 13,286 | 12,007 | 12,553 | 13,560 | 14,544 |
| 2005 | 13,682 | 11,050 | 12,097 | 12,981 | 14,111 | 13,197 | 13,676 | 12,736 | 13,674 | 13,335 | 13,075 | 14,133 |
| 2006 | 14,603 | 13,153 | 11,421 | 9,822 | 10,539 | 5,977 | 5,013 | 5,391 | 4,501 | 4,242 | 3,819 | 4,300 |
| 2007 | 4,397 | 3,263 | 3,611 | 3,463 | 3,163 | 2,013 | 1,930 | 1,729 | 1,329 | 1,722 | 1,316 | 1,839 |
| 2008 | 1,698 | 1,414 | 1,264 | 1,375 | 1,943 | 1,778 | 1,621 | 1,642 | 2,185 | 1,808 | 1,846 | 1,208 |
| 2009 | 1,788 | 1,445 | 1,601 | 1,676 | 1,684 | 1,881 | 1,439 | 1,427 | 2,038 | 1,841 | 1,624 | 1,639 |
| 2010 | 1,202 | 1,069 | 1,237 | 794 | 1,360 | 979 | 1,004 | -32 | 229 | 518 | 209 | 364 |
| 2011 | 315 | 277 | 358 | 384 | 710 | 91 | 304 | 289 | 317 | 270 | 283 | 306 |
| 2012 | 468 | 267 | 247 | 135 | 92 | 80 | 93 | 48 | 9 | 56 | 65 | 77 |
| 2013 | 50 | 15 | 40 | 71 | 76 | 31 | 50 | 60 | 43 | 62 | 41 | 41 |
| 2014 | 65 | 63 | 71 | 73 | 38 | -6 | 0 | -50 | ||||
| 2015 | 0 | -90 | -120 | -151 | -31 | |||||||
| 2016 | -60 | -15 | -30 | -20 | -35 | -48 | -81 | -157 | -150 | -35 | ||
| 2017 | -46 | -104 | -103 | -176 | -182 | -60 | -60 | -60 | ||||
| 2018 | -20 | -29 | -60 | -19 | -55 | -69 | -48 | -2 | ||||
| 2019 | -9 | -67 | -23 | -46 | -23 | |||||||
| 2020 | -37 | -2 | -25 | |||||||||
| 2021 | 64 | -61 | -30 | |||||||||
| - = No Data Reported; -- = Not Applicable; NA = Not Available; W = Withheld to avoid disclosure of individual company data. |
| Release Date: 3/29/2024 |
| Next Release Date: 4/30/2024 |