|
Download Data (XLS File) |
|
||||||||
|
||||||||
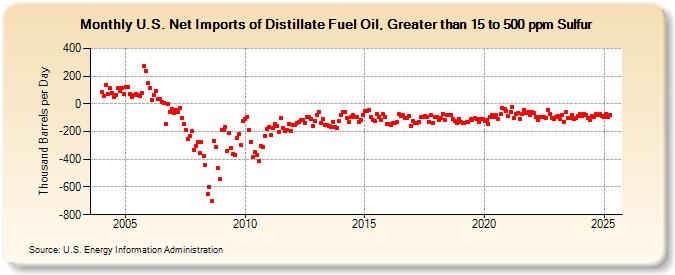
| U.S. Net Imports of Distillate Fuel Oil, Greater than 15 to 500 ppm Sulfur (Thousand Barrels per Day) | ||||||||
| Year | Jan | Feb | Mar | Apr | May | Jun | Jul | Aug | Sep | Oct | Nov | Dec |
|---|---|---|---|---|---|---|---|---|---|---|---|---|
| 2004 | 85 | 55 | 134 | 70 | 114 | 80 | 48 | 65 | 113 | 89 | 112 | 71 |
| 2005 | 118 | 119 | 69 | 46 | 62 | 72 | 64 | 58 | 81 | 271 | 240 | 147 |
| 2006 | 111 | 27 | 63 | 96 | 33 | 35 | 16 | 9 | -149 | 1 | -57 | -35 |
| 2007 | -65 | -46 | -57 | -31 | -101 | -149 | -186 | -252 | -232 | -199 | -333 | -302 |
| 2008 | -278 | -357 | -273 | -373 | -442 | -652 | -600 | -702 | -266 | -310 | -463 | -543 |
| 2009 | -190 | -186 | -168 | -337 | -213 | -317 | -361 | -366 | -243 | -216 | -297 | -126 |
| 2010 | -112 | -92 | -189 | -275 | -386 | -351 | -370 | -409 | -306 | -312 | -234 | -180 |
| 2011 | -168 | -223 | -177 | -148 | -160 | -203 | -101 | -176 | -195 | -191 | -147 | -195 |
| 2012 | -150 | -155 | -136 | -131 | -116 | -119 | -139 | -93 | -95 | -110 | -158 | -123 |
| 2013 | -80 | -59 | -136 | -108 | -150 | -154 | -161 | -170 | -128 | -165 | -172 | -127 |
| 2014 | -83 | -60 | -59 | -104 | -130 | -98 | -83 | -95 | -92 | -132 | -118 | -81 |
| 2015 | -55 | -53 | -44 | -96 | -116 | -125 | -73 | -93 | -115 | -76 | -97 | -142 |
| 2016 | -142 | -151 | -140 | -140 | -131 | -74 | -89 | -81 | -105 | -99 | -85 | -159 |
| 2017 | -122 | -137 | -140 | -128 | -97 | -97 | -89 | -93 | -129 | -83 | -135 | -98 |
| 2018 | -94 | -119 | -100 | -75 | -114 | -78 | -78 | -84 | -112 | -127 | -137 | -111 |
| 2019 | -132 | -140 | -135 | -129 | -129 | -112 | -114 | -102 | -109 | -129 | -107 | -107 |
| 2020 | -125 | -119 | -146 | -98 | -82 | -96 | -81 | -113 | -75 | -28 | -38 | -53 |
| 2021 | -90 | -56 | -23 | -101 | -72 | -65 | -107 | -76 | -42 | -68 | -56 | -78 |
| 2022 | -59 | -69 | -97 | -115 | -96 | -93 | -97 | -101 | -41 | -75 | -99 | -107 |
| 2023 | -96 | -87 | -108 | -81 | -127 | -70 | -99 | -101 | -74 | -99 | -98 | -88 |
| 2024 | -76 | |||||||||||
| - = No Data Reported; -- = Not Applicable; NA = Not Available; W = Withheld to avoid disclosure of individual company data. |
| Release Date: 3/29/2024 |
| Next Release Date: 4/30/2024 |