|
Download Data (XLS File) |
|
||||||||
|
||||||||
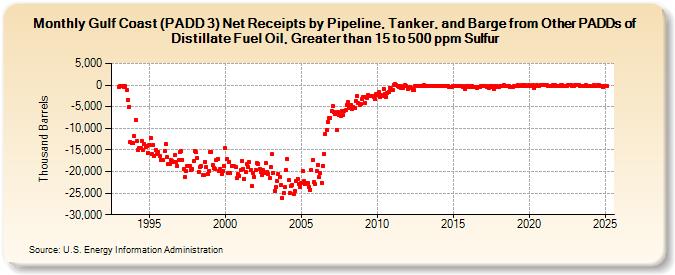
| Gulf Coast (PADD 3) Net Receipts by Pipeline, Tanker, and Barge from Other PADDs of Distillate Fuel Oil, Greater than 15 to 500 ppm Sulfur (Thousand Barrels) | ||||||||
| Year | Jan | Feb | Mar | Apr | May | Jun | Jul | Aug | Sep | Oct | Nov | Dec |
|---|---|---|---|---|---|---|---|---|---|---|---|---|
| 1993 | -387 | -320 | -175 | -311 | -457 | -276 | -1,034 | -3,345 | -5,003 | -13,097 | -13,368 | -13,406 |
| 1994 | -11,827 | -8,040 | -12,906 | -14,980 | -14,650 | -14,529 | -12,914 | -14,988 | -13,667 | -14,333 | -14,102 | -15,606 |
| 1995 | -13,759 | -12,244 | -15,971 | -13,819 | -16,312 | -14,918 | -16,028 | -15,467 | -16,483 | -17,346 | -17,369 | -17,364 |
| 1996 | -15,162 | -13,746 | -16,736 | -18,201 | -18,307 | -17,437 | -17,580 | -17,795 | -16,277 | -17,714 | -18,822 | -17,402 |
| 1997 | -15,511 | -15,251 | -17,258 | -19,461 | -21,321 | -19,885 | -18,673 | -18,812 | -18,631 | -19,642 | -19,352 | -17,676 |
| 1998 | -15,143 | -15,591 | -16,816 | -20,036 | -19,028 | -18,797 | -20,906 | -20,761 | -17,723 | -19,016 | -20,534 | -19,839 |
| 1999 | -15,387 | -15,530 | -18,487 | -19,118 | -19,428 | -17,289 | -17,022 | -19,813 | -19,320 | -20,588 | -19,775 | -18,707 |
| 2000 | -14,598 | -17,195 | -20,282 | -17,723 | -20,452 | -18,818 | -18,806 | -18,728 | -18,855 | -21,571 | -20,615 | -20,979 |
| 2001 | -19,721 | -17,495 | -19,312 | -21,757 | -20,049 | -18,355 | -18,935 | -17,838 | -19,674 | -23,442 | -20,365 | -21,296 |
| 2002 | -19,605 | -18,007 | -18,188 | -19,339 | -20,139 | -20,766 | -19,763 | -20,385 | -17,986 | -20,082 | -20,491 | -21,583 |
| 2003 | -19,033 | -16,014 | -20,276 | -24,507 | -23,662 | -22,282 | -20,691 | -21,313 | -23,114 | -26,158 | -24,944 | -23,659 |
| 2004 | -19,680 | -17,164 | -22,057 | -24,883 | -23,266 | -23,102 | -25,320 | -24,538 | -22,121 | -21,696 | -22,812 | -23,564 |
| 2005 | -22,567 | -19,994 | -22,298 | -23,002 | -22,755 | -22,609 | -23,576 | -24,208 | -19,619 | -17,261 | -22,352 | -22,985 |
| 2006 | -19,923 | -18,396 | -21,374 | -20,372 | -22,550 | -18,703 | -15,861 | -11,279 | -10,471 | -8,532 | -7,508 | -7,600 |
| 2007 | -6,033 | -4,928 | -6,256 | -6,679 | -10,387 | -6,158 | -6,817 | -7,182 | -6,062 | -6,852 | -5,992 | -5,873 |
| 2008 | -4,549 | -3,891 | -5,292 | -4,710 | -5,615 | -5,063 | -5,264 | -3,748 | -2,638 | -4,211 | -4,538 | -4,463 |
| 2009 | -3,314 | -2,759 | -4,057 | -2,799 | -3,046 | -2,362 | -2,421 | -2,536 | -2,411 | -2,660 | -3,247 | -2,129 |
| 2010 | -2,242 | -1,711 | -2,685 | -2,227 | -2,531 | -798 | -2,006 | -2,792 | -1,924 | -1,539 | -639 | -987 |
| 2011 | -1,178 | 93 | 189 | -31 | -248 | -401 | -251 | -767 | -582 | -288 | 53 | -137 |
| 2012 | -894 | -698 | -464 | -691 | -1,197 | -1,164 | -257 | -257 | -173 | -224 | -307 | -318 |
| 2013 | -194 | -70 | -318 | -159 | -228 | -302 | -107 | -181 | -231 | -144 | -153 | -304 |
| 2014 | -127 | -220 | -265 | -117 | -227 | -144 | -162 | -139 | -176 | -438 | -400 | -446 |
| 2015 | -245 | -189 | -154 | -111 | -199 | -294 | -163 | -264 | -530 | -1,021 | -254 | -397 |
| 2016 | -227 | -186 | -480 | -234 | -452 | -344 | -380 | -568 | -457 | -514 | -283 | -194 |
| 2017 | -155 | -259 | -256 | -481 | -577 | -309 | -358 | -155 | -941 | -436 | -130 | -347 |
| 2018 | -551 | -228 | -103 | -113 | -66 | -96 | -114 | -115 | -172 | -453 | -367 | -389 |
| 2019 | -210 | -134 | -137 | -94 | -126 | -98 | -55 | -179 | -109 | -84 | -304 | -169 |
| 2020 | -94 | -99 | -126 | -92 | -768 | -120 | -65 | -308 | -125 | -73 | -80 | -91 |
| 2021 | -23 | -42 | -43 | -117 | -105 | -101 | -192 | -82 | -61 | -137 | -135 | -108 |
| 2022 | -135 | -54 | -87 | -274 | -301 | -102 | -117 | -76 | -92 | -26 | -105 | -148 |
| 2023 | -88 | -56 | -76 | -69 | -98 | -105 | -109 | -217 | -137 | -95 | -126 | -133 |
| 2024 | -133 | |||||||||||
| - = No Data Reported; -- = Not Applicable; NA = Not Available; W = Withheld to avoid disclosure of individual company data. |
| Release Date: 3/29/2024 |
| Next Release Date: 4/30/2024 |
Referring Pages: