|
Download Data (XLS File) |
|
||||||||
|
||||||||
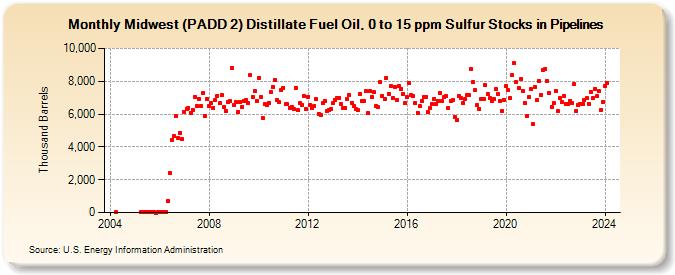
| Midwest (PADD 2) Distillate Fuel Oil, 0 to 15 ppm Sulfur Stocks in Pipelines (Thousand Barrels) | ||||||||
| Year | Jan | Feb | Mar | Apr | May | Jun | Jul | Aug | Sep | Oct | Nov | Dec |
|---|---|---|---|---|---|---|---|---|---|---|---|---|
| 2004 | 17 | |||||||||||
| 2005 | 9 | 9 | 20 | 13 | 4 | 6 | 6 | 3 | 11 | |||
| 2006 | 13 | 23 | 19 | 49 | 721 | 2,420 | 4,440 | 4,656 | 5,866 | 4,528 | 4,875 | 4,464 |
| 2007 | 6,128 | 6,293 | 6,373 | 6,093 | 6,262 | 7,054 | 6,469 | 6,940 | 6,480 | 7,259 | 5,891 | 6,930 |
| 2008 | 6,505 | 6,688 | 6,381 | 6,870 | 7,118 | 6,655 | 7,133 | 6,425 | 6,216 | 6,739 | 6,767 | 8,810 |
| 2009 | 6,557 | 6,712 | 6,121 | 6,731 | 6,432 | 6,775 | 6,853 | 6,663 | 8,363 | 7,069 | 7,411 | 6,825 |
| 2010 | 8,211 | 7,037 | 5,788 | 6,624 | 6,533 | 6,685 | 7,316 | 7,669 | 8,096 | 6,832 | 6,718 | 7,439 |
| 2011 | 7,603 | 6,598 | 6,591 | 6,398 | 6,442 | 6,279 | 7,610 | 6,217 | 6,649 | 6,543 | 7,072 | 6,308 |
| 2012 | 7,065 | 6,579 | 6,349 | 6,489 | 6,902 | 6,030 | 5,938 | 6,666 | 6,793 | 6,167 | 6,225 | 6,279 |
| 2013 | 6,678 | 6,839 | 6,975 | 6,986 | 6,603 | 6,378 | 6,390 | 6,918 | 7,162 | 6,691 | 6,486 | 6,333 |
| 2014 | 6,217 | 7,208 | 6,788 | 6,817 | 7,376 | 6,062 | 7,382 | 7,058 | 7,329 | 6,501 | 6,416 | 7,937 |
| 2015 | 7,107 | 6,932 | 8,201 | 7,238 | 7,695 | 6,994 | 7,672 | 6,843 | 7,690 | 7,536 | 7,220 | 6,648 |
| 2016 | 7,014 | 7,920 | 7,158 | 7,079 | 6,663 | 6,080 | 6,462 | 6,824 | 7,017 | 7,059 | 6,121 | 6,368 |
| 2017 | 6,601 | 6,940 | 6,638 | 6,814 | 7,269 | 6,795 | 7,020 | 7,083 | 6,359 | 6,778 | 6,829 | 5,844 |
| 2018 | 5,664 | 7,094 | 6,977 | 6,687 | 6,897 | 7,181 | 7,144 | 8,723 | 7,932 | 7,436 | 6,528 | 6,332 |
| 2019 | 6,921 | 6,900 | 7,741 | 7,212 | 6,961 | 6,766 | 6,907 | 7,524 | 7,238 | 6,794 | 6,174 | 6,879 |
| 2020 | 7,698 | 7,450 | 6,980 | 8,378 | 9,107 | 7,935 | 7,570 | 8,120 | 7,414 | 6,676 | 5,869 | 7,047 |
| 2021 | 7,510 | 5,365 | 7,676 | 6,836 | 8,019 | 7,184 | 8,704 | 8,774 | 7,985 | 7,300 | 6,449 | 6,653 |
| 2022 | 7,432 | 6,162 | 6,952 | 6,729 | 7,107 | 6,637 | 6,625 | 6,821 | 6,665 | 7,808 | 6,159 | 6,546 |
| 2023 | 6,625 | 6,633 | 6,837 | 6,960 | 6,628 | 7,361 | 6,961 | 7,537 | 7,076 | 7,388 | 6,242 | 6,742 |
| 2024 | 7,686 | |||||||||||
| - = No Data Reported; -- = Not Applicable; NA = Not Available; W = Withheld to avoid disclosure of individual company data. |
| Release Date: 3/29/2024 |
| Next Release Date: 4/30/2024 |