|
Download Data (XLS File) |
|
||||||||
|
||||||||
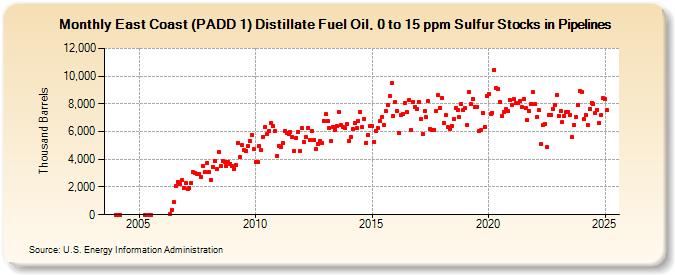
| East Coast (PADD 1) Distillate Fuel Oil, 0 to 15 ppm Sulfur Stocks in Pipelines (Thousand Barrels) | ||||||||
| Year | Jan | Feb | Mar | Apr | May | Jun | Jul | Aug | Sep | Oct | Nov | Dec |
|---|---|---|---|---|---|---|---|---|---|---|---|---|
| 2004 | 9 | 8 | 9 | |||||||||
| 2005 | 7 | 9 | 7 | |||||||||
| 2006 | 81 | 343 | 908 | 2,080 | 2,391 | 2,215 | 2,500 | 1,937 | ||||
| 2007 | 2,255 | 1,858 | 1,938 | 2,298 | 3,049 | 3,015 | 2,961 | 2,949 | 2,727 | 3,505 | 3,107 | 3,764 |
| 2008 | 3,057 | 2,516 | 3,463 | 3,879 | 3,296 | 4,540 | 3,514 | 3,858 | 3,837 | 3,498 | 3,794 | 3,682 |
| 2009 | 3,500 | 3,318 | 3,600 | 5,180 | 4,168 | 5,008 | 4,646 | 4,621 | 4,961 | 5,324 | 5,780 | 4,709 |
| 2010 | 3,801 | 3,794 | 4,955 | 4,665 | 5,643 | 6,339 | 5,820 | 6,054 | 6,636 | 6,376 | 6,047 | 4,246 |
| 2011 | 4,977 | 4,888 | 5,185 | 6,026 | 5,910 | 5,844 | 5,978 | 5,620 | 4,593 | 5,526 | 5,991 | 4,581 |
| 2012 | 6,222 | 5,222 | 5,609 | 6,257 | 5,395 | 6,060 | 5,380 | 4,737 | 5,122 | 5,306 | 5,179 | 6,796 |
| 2013 | 7,237 | 6,793 | 6,251 | 5,303 | 6,364 | 6,131 | 6,373 | 7,406 | 6,455 | 6,304 | 6,239 | 6,536 |
| 2014 | 5,310 | 5,609 | 6,177 | 6,600 | 6,233 | 6,766 | 7,439 | 6,327 | 6,941 | 5,184 | 5,763 | 6,391 |
| 2015 | 6,394 | 5,273 | 6,049 | 6,240 | 6,757 | 7,063 | 6,475 | 7,462 | 7,917 | 8,582 | 9,482 | 7,149 |
| 2016 | 8,154 | 7,500 | 5,880 | 7,228 | 7,290 | 8,095 | 7,405 | 8,289 | 6,118 | 8,149 | 7,794 | 7,637 |
| 2017 | 8,166 | 6,890 | 5,853 | 7,453 | 7,021 | 8,182 | 6,187 | 6,111 | 6,118 | 7,468 | 8,611 | 7,684 |
| 2018 | 8,439 | 6,636 | 7,188 | 6,294 | 6,193 | 6,427 | 6,896 | 7,665 | 7,565 | 7,026 | 7,956 | 7,541 |
| 2019 | 7,666 | 6,462 | 8,873 | 7,967 | 8,332 | 7,746 | 7,803 | 6,028 | 6,091 | 7,362 | 6,319 | 8,555 |
| 2020 | 8,674 | 7,245 | 7,371 | 10,468 | 9,127 | 9,065 | 8,098 | 7,122 | 7,397 | 7,606 | 7,454 | 8,244 |
| 2021 | 7,946 | 8,315 | 8,046 | 8,057 | 8,176 | 7,784 | 8,315 | 7,676 | 6,844 | 7,500 | 8,010 | 8,823 |
| 2022 | 7,960 | 7,036 | 7,532 | 5,104 | 6,454 | 6,573 | 4,880 | 7,192 | 7,213 | 7,597 | 7,912 | 8,654 |
| 2023 | 7,151 | 7,480 | 6,600 | 7,155 | 7,381 | 7,425 | 7,175 | 5,612 | 6,477 | 7,062 | 7,932 | 8,894 |
| 2024 | 8,868 | |||||||||||
| - = No Data Reported; -- = Not Applicable; NA = Not Available; W = Withheld to avoid disclosure of individual company data. |
| Release Date: 3/29/2024 |
| Next Release Date: 4/30/2024 |