|
Download Data (XLS File) |
|
||||||||
|
||||||||
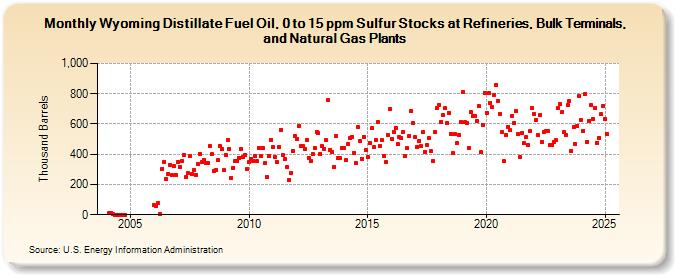
| Wyoming Distillate Fuel Oil, 0 to 15 ppm Sulfur Stocks at Refineries, Bulk Terminals, and Natural Gas Plants (Thousand Barrels) | ||||||||
| Year | Jan | Feb | Mar | Apr | May | Jun | Jul | Aug | Sep | Oct | Nov | Dec |
|---|---|---|---|---|---|---|---|---|---|---|---|---|
| 2004 | 9 | 9 | 2 | 1 | 1 | 1 | 1 | 1 | 1 | |||
| 2006 | 62 | 58 | 78 | 4 | 304 | 351 | 238 | 272 | 331 | 261 | 319 | 265 |
| 2007 | 349 | 317 | 354 | 397 | 248 | 274 | 385 | 271 | 298 | 261 | 334 | 404 |
| 2008 | 346 | 364 | 344 | 341 | 456 | 401 | 290 | 297 | 362 | 456 | 434 | 294 |
| 2009 | 397 | 492 | 433 | 246 | 311 | 357 | 352 | 377 | 432 | 384 | 398 | 303 |
| 2010 | 347 | 371 | 357 | 389 | 354 | 444 | 388 | 441 | 343 | 250 | 391 | 496 |
| 2011 | 447 | 380 | 346 | 447 | 562 | 396 | 367 | 317 | 227 | 275 | 420 | 522 |
| 2012 | 503 | 587 | 454 | 455 | 434 | 494 | 377 | 352 | 400 | 440 | 549 | 538 |
| 2013 | 403 | 452 | 435 | 494 | 756 | 429 | 412 | 318 | 522 | 375 | 375 | 440 |
| 2014 | 440 | 362 | 468 | 507 | 517 | 411 | 341 | 581 | 485 | 369 | 514 | 425 |
| 2015 | 379 | 473 | 571 | 445 | 496 | 610 | 455 | 494 | 389 | 348 | 528 | 698 |
| 2016 | 500 | 550 | 575 | 469 | 513 | 506 | 549 | 391 | 440 | 523 | 684 | 608 |
| 2017 | 512 | 450 | 490 | 452 | 545 | 417 | 461 | 504 | 419 | 355 | 546 | 704 |
| 2018 | 726 | 616 | 657 | 703 | 604 | 675 | 534 | 406 | 533 | 471 | 526 | 614 |
| 2019 | 811 | 610 | 604 | 443 | 676 | 651 | 654 | 621 | 717 | 413 | 596 | 805 |
| 2020 | 675 | 802 | 738 | 715 | 794 | 861 | 752 | 666 | 544 | 352 | 525 | 582 |
| 2021 | 558 | 656 | 607 | 684 | 533 | 381 | 538 | 471 | 515 | 463 | 551 | 703 |
| 2022 | 665 | 627 | 527 | 658 | 484 | 547 | 553 | 554 | 459 | 459 | 482 | 493 |
| 2023 | 704 | 778 | 677 | 544 | 529 | 726 | 750 | 424 | 582 | 466 | 585 | 783 |
| 2024 | 624 | |||||||||||
| - = No Data Reported; -- = Not Applicable; NA = Not Available; W = Withheld to avoid disclosure of individual company data. |
| Release Date: 3/29/2024 |
| Next Release Date: 4/30/2024 |