|
Download Data (XLS File) |
|
||||||||
|
||||||||
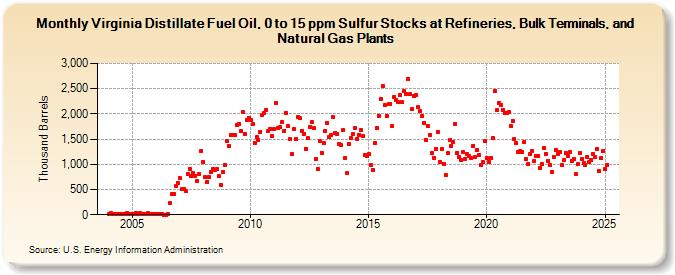
| Virginia Distillate Fuel Oil, 0 to 15 ppm Sulfur Stocks at Refineries, Bulk Terminals, and Natural Gas Plants (Thousand Barrels) | ||||||||
| Year | Jan | Feb | Mar | Apr | May | Jun | Jul | Aug | Sep | Oct | Nov | Dec |
|---|---|---|---|---|---|---|---|---|---|---|---|---|
| 2004 | 10 | 26 | 13 | 8 | 11 | 13 | 21 | 11 | 14 | 33 | 8 | 21 |
| 2005 | 23 | 17 | 32 | 11 | 25 | 21 | 15 | 17 | 29 | 13 | 10 | 18 |
| 2006 | 10 | 19 | 20 | 11 | 4 | 3 | 18 | 230 | 403 | 403 | 574 | 637 |
| 2007 | 722 | 507 | 508 | 476 | 810 | 915 | 761 | 832 | 767 | 668 | 803 | 1,270 |
| 2008 | 1,048 | 747 | 655 | 752 | 845 | 916 | 896 | 899 | 761 | 596 | 847 | 990 |
| 2009 | 1,454 | 1,363 | 1,577 | 1,576 | 1,573 | 1,771 | 1,804 | 1,656 | 2,031 | 1,602 | 1,872 | 1,926 |
| 2010 | 1,882 | 1,793 | 1,432 | 1,535 | 1,485 | 1,646 | 1,985 | 2,010 | 2,080 | 1,666 | 1,707 | 1,571 |
| 2011 | 1,703 | 2,221 | 1,719 | 1,731 | 1,836 | 1,663 | 2,024 | 1,752 | 1,499 | 1,204 | 1,698 | 1,505 |
| 2012 | 1,948 | 1,921 | 1,670 | 1,610 | 1,309 | 1,527 | 1,743 | 1,832 | 1,716 | 1,112 | 904 | 1,464 |
| 2013 | 1,234 | 1,420 | 1,657 | 1,814 | 1,545 | 1,591 | 1,936 | 1,628 | 1,599 | 1,412 | 1,378 | 1,680 |
| 2014 | 1,131 | 821 | 1,410 | 1,515 | 1,609 | 1,728 | 1,502 | 1,591 | 1,679 | 1,558 | 1,183 | 1,163 |
| 2015 | 1,208 | 987 | 889 | 1,424 | 1,712 | 1,966 | 2,302 | 2,552 | 2,176 | 1,963 | 2,188 | 2,192 |
| 2016 | 1,755 | 2,336 | 2,279 | 2,229 | 2,374 | 2,228 | 2,451 | 2,390 | 2,697 | 2,387 | 2,094 | 2,360 |
| 2017 | 2,379 | 2,143 | 2,062 | 1,962 | 1,814 | 1,490 | 1,760 | 1,580 | 1,228 | 1,132 | 1,311 | 1,647 |
| 2018 | 1,046 | 1,299 | 1,014 | 794 | 1,216 | 1,485 | 1,370 | 1,433 | 1,805 | 1,223 | 1,149 | 1,085 |
| 2019 | 1,238 | 1,114 | 1,198 | 1,162 | 1,134 | 1,363 | 1,149 | 1,278 | 1,190 | 979 | 1,039 | 1,454 |
| 2020 | 1,124 | 1,044 | 1,125 | 1,526 | 2,449 | 2,070 | 2,221 | 2,182 | 2,074 | 2,013 | 2,026 | 2,038 |
| 2021 | 1,768 | 1,863 | 1,501 | 1,432 | 1,239 | 1,272 | 1,249 | 1,443 | 1,103 | 1,015 | 1,206 | 1,260 |
| 2022 | 1,064 | 1,162 | 1,161 | 934 | 999 | 1,319 | 1,210 | 1,073 | 981 | 852 | 1,143 | 1,279 |
| 2023 | 1,211 | 1,247 | 985 | 1,076 | 1,221 | 1,174 | 1,241 | 1,072 | 1,098 | 800 | 1,001 | 1,225 |
| 2024 | 1,113 | |||||||||||
| - = No Data Reported; -- = Not Applicable; NA = Not Available; W = Withheld to avoid disclosure of individual company data. |
| Release Date: 3/29/2024 |
| Next Release Date: 4/30/2024 |