|
Download Data (XLS File) |
|
||||||||
|
||||||||
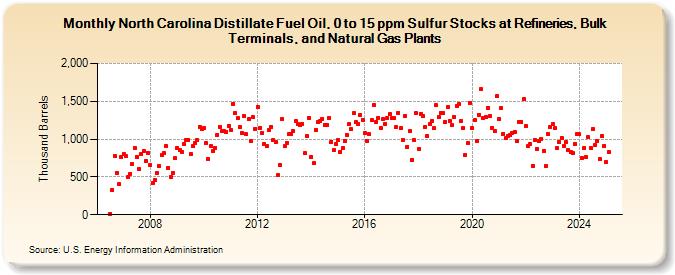
| North Carolina Distillate Fuel Oil, 0 to 15 ppm Sulfur Stocks at Refineries, Bulk Terminals, and Natural Gas Plants (Thousand Barrels) | ||||||||
| Year | Jan | Feb | Mar | Apr | May | Jun | Jul | Aug | Sep | Oct | Nov | Dec |
|---|---|---|---|---|---|---|---|---|---|---|---|---|
| 2006 | 15 | 330 | 778 | 558 | 403 | 763 | ||||||
| 2007 | 804 | 775 | 502 | 542 | 667 | 879 | 769 | 607 | 799 | 836 | 714 | 822 |
| 2008 | 658 | 419 | 459 | 547 | 643 | 787 | 814 | 906 | 623 | 505 | 558 | 744 |
| 2009 | 881 | 851 | 835 | 932 | 989 | 993 | 799 | 908 | 954 | 987 | 1,164 | 1,133 |
| 2010 | 1,150 | 947 | 734 | 903 | 846 | 883 | 1,058 | 1,165 | 1,104 | 1,107 | 1,095 | 1,174 |
| 2011 | 1,119 | 1,467 | 1,348 | 1,275 | 1,159 | 1,087 | 1,301 | 1,066 | 1,262 | 976 | 1,286 | 1,136 |
| 2012 | 1,429 | 1,150 | 1,081 | 938 | 903 | 1,119 | 1,166 | 986 | 957 | 519 | 656 | 1,268 |
| 2013 | 903 | 952 | 1,062 | 1,072 | 1,106 | 1,236 | 1,195 | 1,189 | 1,205 | 812 | 1,039 | 1,283 |
| 2014 | 760 | 683 | 1,126 | 1,227 | 1,237 | 1,270 | 1,188 | 1,192 | 1,281 | 965 | 851 | 936 |
| 2015 | 990 | 833 | 878 | 976 | 1,058 | 1,197 | 1,130 | 1,340 | 1,220 | 1,205 | 1,319 | 1,257 |
| 2016 | 1,082 | 980 | 1,063 | 1,249 | 1,454 | 1,230 | 1,280 | 1,142 | 1,260 | 1,205 | 1,279 | 1,328 |
| 2017 | 1,274 | 1,274 | 1,154 | 1,351 | 1,144 | 993 | 1,312 | 897 | 1,104 | 728 | 988 | 1,340 |
| 2018 | 872 | 1,334 | 1,301 | 1,163 | 1,044 | 1,195 | 1,241 | 1,143 | 1,447 | 1,293 | 1,351 | 1,339 |
| 2019 | 1,230 | 1,418 | 1,243 | 1,180 | 1,293 | 1,442 | 1,462 | 1,240 | 1,148 | 793 | 942 | 1,480 |
| 2020 | 1,143 | 1,250 | 970 | 1,322 | 1,659 | 1,277 | 1,295 | 1,416 | 1,299 | 1,151 | 1,107 | 1,565 |
| 2021 | 1,264 | 1,411 | 1,072 | 1,014 | 1,040 | 1,049 | 1,087 | 1,100 | 969 | 1,231 | 1,226 | 1,528 |
| 2022 | 1,168 | 909 | 932 | 648 | 987 | 873 | 969 | 1,002 | 848 | 647 | 1,070 | 1,160 |
| 2023 | 1,195 | 1,145 | 876 | 959 | 1,019 | 918 | 956 | 851 | 825 | 814 | 941 | 1,071 |
| 2024 | 1,063 | 753 | 880 | 761 | ||||||||
| - = No Data Reported; -- = Not Applicable; NA = Not Available; W = Withheld to avoid disclosure of individual company data. |
| Release Date: 6/28/2024 |
| Next Release Date: 7/31/2024 |