|
Download Data (XLS File) |
|
||||||||
|
||||||||
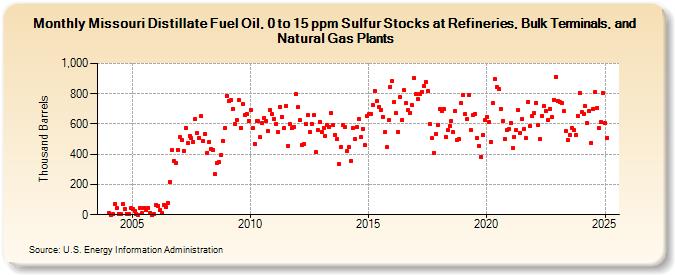
| Missouri Distillate Fuel Oil, 0 to 15 ppm Sulfur Stocks at Refineries, Bulk Terminals, and Natural Gas Plants (Thousand Barrels) | ||||||||
| Year | Jan | Feb | Mar | Apr | May | Jun | Jul | Aug | Sep | Oct | Nov | Dec |
|---|---|---|---|---|---|---|---|---|---|---|---|---|
| 2004 | 10 | 1 | 2 | 74 | 42 | 8 | 2 | 71 | 38 | 7 | 6 | 42 |
| 2005 | 37 | 27 | 4 | 1 | 43 | 9 | 47 | 28 | 47 | 14 | 1 | 2 |
| 2006 | 65 | 60 | 31 | 10 | 66 | 48 | 78 | 219 | 425 | 356 | 339 | 431 |
| 2007 | 514 | 491 | 422 | 575 | 471 | 522 | 504 | 483 | 631 | 541 | 507 | 650 |
| 2008 | 486 | 533 | 411 | 482 | 436 | 429 | 268 | 341 | 346 | 398 | 487 | 574 |
| 2009 | 787 | 752 | 756 | 701 | 601 | 629 | 757 | 576 | 731 | 660 | 669 | 620 |
| 2010 | 692 | 572 | 470 | 619 | 617 | 512 | 606 | 639 | 621 | 554 | 691 | 664 |
| 2011 | 633 | 603 | 545 | 713 | 648 | 571 | 720 | 457 | 598 | 572 | 583 | 795 |
| 2012 | 709 | 623 | 462 | 465 | 601 | 659 | 547 | 603 | 659 | 412 | 560 | 616 |
| 2013 | 550 | 575 | 519 | 592 | 583 | 673 | 594 | 526 | 502 | 335 | 451 | 593 |
| 2014 | 577 | 421 | 446 | 356 | 576 | 501 | 580 | 633 | 512 | 569 | 459 | 650 |
| 2015 | 664 | 669 | 724 | 819 | 749 | 711 | 693 | 649 | 545 | 446 | 626 | 847 |
| 2016 | 882 | 748 | 671 | 549 | 777 | 629 | 822 | 738 | 690 | 674 | 723 | 903 |
| 2017 | 798 | 764 | 797 | 812 | 848 | 877 | 816 | 598 | 504 | 410 | 536 | 595 |
| 2018 | 697 | 687 | 701 | 514 | 557 | 585 | 622 | 545 | 685 | 495 | 501 | 740 |
| 2019 | 790 | 663 | 630 | 791 | 559 | 660 | 669 | 506 | 456 | 384 | 524 | 626 |
| 2020 | 649 | 613 | 482 | 736 | 899 | 846 | 833 | 702 | 622 | 500 | 557 | 564 |
| 2021 | 607 | 442 | 516 | 557 | 694 | 542 | 634 | 569 | 504 | 748 | 588 | 650 |
| 2022 | 672 | 740 | 590 | 501 | 655 | 720 | 687 | 628 | 702 | 645 | 761 | 913 |
| 2023 | 676 | 680 | 737 | 683 | 552 | 494 | 529 | 574 | 557 | 527 | 656 | 806 |
| 2024 | 680 | |||||||||||
| - = No Data Reported; -- = Not Applicable; NA = Not Available; W = Withheld to avoid disclosure of individual company data. |
| Release Date: 3/29/2024 |
| Next Release Date: 4/30/2024 |