|
Download Data (XLS File) |
|
||||||||
|
||||||||
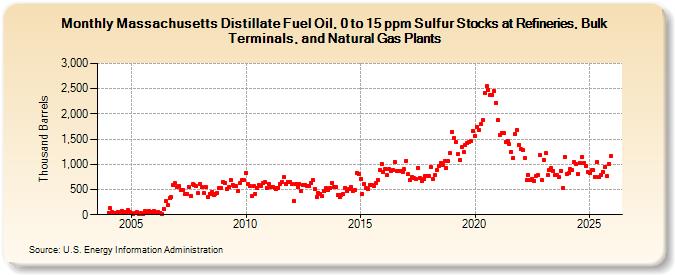
| Massachusetts Distillate Fuel Oil, 0 to 15 ppm Sulfur Stocks at Refineries, Bulk Terminals, and Natural Gas Plants (Thousand Barrels) | ||||||||
| Year | Jan | Feb | Mar | Apr | May | Jun | Jul | Aug | Sep | Oct | Nov | Dec |
|---|---|---|---|---|---|---|---|---|---|---|---|---|
| 2004 | 43 | 126 | 57 | 33 | 33 | 55 | 36 | 82 | 62 | 40 | 84 | 60 |
| 2005 | 37 | 17 | 25 | 44 | 23 | 33 | 15 | 64 | 41 | 82 | 59 | 28 |
| 2006 | 66 | 40 | 58 | 36 | 14 | 109 | 269 | 186 | 330 | 349 | 584 | 621 |
| 2007 | 556 | 561 | 485 | 496 | 408 | 419 | 556 | 364 | 600 | 589 | 561 | 424 |
| 2008 | 603 | 552 | 429 | 541 | 357 | 417 | 450 | 382 | 402 | 434 | 539 | 527 |
| 2009 | 649 | 627 | 509 | 541 | 696 | 598 | 578 | 564 | 475 | 631 | 681 | 681 |
| 2010 | 827 | 601 | 574 | 372 | 568 | 420 | 522 | 589 | 579 | 631 | 641 | 534 |
| 2011 | 618 | 540 | 547 | 522 | 518 | 539 | 619 | 649 | 752 | 603 | 654 | 656 |
| 2012 | 606 | 272 | 603 | 546 | 610 | 464 | 592 | 590 | 573 | 574 | 628 | 690 |
| 2013 | 503 | 349 | 437 | 410 | 366 | 464 | 528 | 489 | 530 | 635 | 550 | 548 |
| 2014 | 391 | 343 | 396 | 415 | 539 | 463 | 517 | 554 | 477 | 500 | 833 | 812 |
| 2015 | 704 | 409 | 607 | 524 | 512 | 599 | 585 | 575 | 626 | 689 | 887 | 1,014 |
| 2016 | 845 | 914 | 779 | 910 | 876 | 887 | 1,054 | 870 | 868 | 874 | 844 | 897 |
| 2017 | 1,075 | 805 | 690 | 751 | 721 | 710 | 933 | 732 | 663 | 704 | 770 | 766 |
| 2018 | 769 | 942 | 706 | 784 | 889 | 965 | 1,033 | 992 | 1,072 | 928 | 1,059 | 1,215 |
| 2019 | 1,642 | 1,521 | 1,441 | 1,204 | 1,090 | 1,334 | 1,242 | 1,377 | 1,420 | 1,445 | 1,458 | 1,656 |
| 2020 | 1,566 | 1,739 | 1,689 | 1,799 | 1,873 | 2,417 | 2,544 | 2,482 | 2,373 | 2,373 | 2,447 | 2,214 |
| 2021 | 1,873 | 1,576 | 1,628 | 1,622 | 1,443 | 1,461 | 1,394 | 1,253 | 1,134 | 1,605 | 1,676 | 1,390 |
| 2022 | 1,303 | 1,279 | 1,119 | 687 | 790 | 688 | 703 | 677 | 766 | 781 | 1,180 | 685 |
| 2023 | 1,093 | 1,218 | 786 | 886 | 920 | 871 | 779 | 785 | 743 | 874 | 531 | 1,149 |
| 2024 | 808 | |||||||||||
| - = No Data Reported; -- = Not Applicable; NA = Not Available; W = Withheld to avoid disclosure of individual company data. |
| Release Date: 3/29/2024 |
| Next Release Date: 4/30/2024 |