|
Download Data (XLS File) |
|
||||||||
|
||||||||
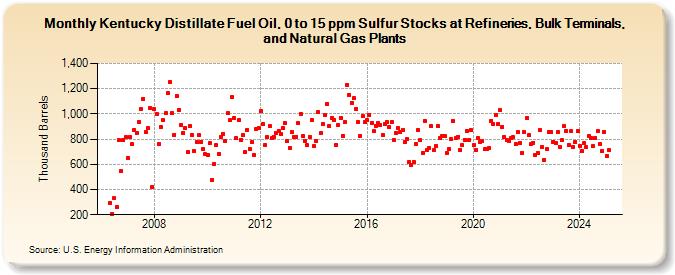
| Kentucky Distillate Fuel Oil, 0 to 15 ppm Sulfur Stocks at Refineries, Bulk Terminals, and Natural Gas Plants (Thousand Barrels) | ||||||||
| Year | Jan | Feb | Mar | Apr | May | Jun | Jul | Aug | Sep | Oct | Nov | Dec |
|---|---|---|---|---|---|---|---|---|---|---|---|---|
| 2006 | 294 | 206 | 329 | 263 | 789 | 546 | 794 | 814 | ||||
| 2007 | 651 | 815 | 759 | 872 | 851 | 937 | 1,035 | 1,121 | 853 | 885 | 1,044 | 418 |
| 2008 | 1,036 | 1,000 | 763 | 895 | 948 | 1,005 | 1,164 | 1,253 | 1,007 | 836 | 1,143 | 1,030 |
| 2009 | 911 | 850 | 887 | 697 | 902 | 829 | 706 | 776 | 834 | 779 | 721 | 679 |
| 2010 | 671 | 766 | 479 | 603 | 750 | 682 | 820 | 844 | 784 | 1,004 | 950 | 1,132 |
| 2011 | 971 | 807 | 950 | 796 | 829 | 695 | 873 | 721 | 775 | 675 | 883 | 887 |
| 2012 | 1,019 | 920 | 751 | 816 | 902 | 805 | 818 | 848 | 868 | 840 | 888 | 925 |
| 2013 | 787 | 731 | 856 | 817 | 818 | 927 | 1,001 | 824 | 788 | 751 | 819 | 952 |
| 2014 | 747 | 783 | 1,015 | 845 | 917 | 988 | 1,081 | 905 | 968 | 948 | 756 | 912 |
| 2015 | 969 | 827 | 934 | 1,233 | 1,152 | 1,090 | 1,123 | 1,042 | 935 | 828 | 983 | 932 |
| 2016 | 948 | 995 | 930 | 861 | 907 | 925 | 910 | 836 | 918 | 932 | 893 | 934 |
| 2017 | 794 | 849 | 885 | 858 | 871 | 775 | 802 | 619 | 594 | 618 | 764 | 872 |
| 2018 | 791 | 693 | 944 | 713 | 731 | 903 | 710 | 746 | 901 | 809 | 826 | 824 |
| 2019 | 691 | 718 | 799 | 943 | 808 | 819 | 712 | 753 | 794 | 867 | 794 | 871 |
| 2020 | 753 | 710 | 810 | 778 | 788 | 719 | 722 | 729 | 946 | 920 | 992 | 921 |
| 2021 | 1,027 | 896 | 817 | 795 | 781 | 805 | 813 | 762 | 858 | 766 | 693 | 854 |
| 2022 | 971 | 829 | 761 | 773 | 675 | 688 | 869 | 739 | 638 | 718 | 854 | 854 |
| 2023 | 778 | 766 | 854 | 740 | 789 | 900 | 866 | 755 | 862 | 739 | 777 | 864 |
| 2024 | 749 | |||||||||||
| - = No Data Reported; -- = Not Applicable; NA = Not Available; W = Withheld to avoid disclosure of individual company data. |
| Release Date: 3/29/2024 |
| Next Release Date: 4/30/2024 |