|
Download Data (XLS File) |
|
||||||||
|
||||||||
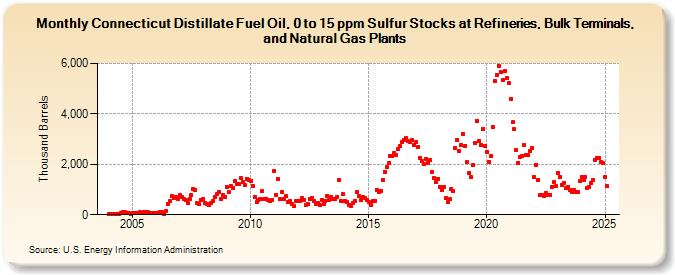
| Connecticut Distillate Fuel Oil, 0 to 15 ppm Sulfur Stocks at Refineries, Bulk Terminals, and Natural Gas Plants (Thousand Barrels) | ||||||||
| Year | Jan | Feb | Mar | Apr | May | Jun | Jul | Aug | Sep | Oct | Nov | Dec |
|---|---|---|---|---|---|---|---|---|---|---|---|---|
| 2004 | 21 | 41 | 24 | 29 | 40 | 42 | 78 | 89 | 90 | 72 | 56 | 35 |
| 2005 | 85 | 58 | 59 | 75 | 93 | 87 | 98 | 88 | 97 | 61 | 69 | 80 |
| 2006 | 78 | 63 | 91 | 91 | 16 | 160 | 432 | 553 | 737 | 674 | 696 | 638 |
| 2007 | 789 | 708 | 633 | 603 | 463 | 624 | 770 | 1,011 | 975 | 447 | 423 | 598 |
| 2008 | 609 | 461 | 418 | 379 | 473 | 539 | 706 | 830 | 901 | 629 | 770 | 701 |
| 2009 | 1,096 | 902 | 1,132 | 1,073 | 1,322 | 1,224 | 1,208 | 1,473 | 1,307 | 1,179 | 1,431 | 1,381 |
| 2010 | 1,345 | 1,153 | 699 | 503 | 581 | 627 | 927 | 620 | 640 | 570 | 552 | 564 |
| 2011 | 1,736 | 797 | 1,418 | 630 | 884 | 635 | 728 | 503 | 532 | 410 | 342 | 528 |
| 2012 | 525 | 544 | 650 | 597 | 395 | 431 | 604 | 653 | 548 | 411 | 467 | 401 |
| 2013 | 593 | 439 | 551 | 754 | 574 | 699 | 604 | 627 | 708 | 1,385 | 540 | 813 |
| 2014 | 528 | 489 | 389 | 343 | 455 | 549 | 892 | 723 | 582 | 693 | 670 | 581 |
| 2015 | 515 | 388 | 531 | 560 | 1,000 | 912 | 960 | 1,371 | 1,713 | 1,880 | 2,049 | 2,338 |
| 2016 | 2,323 | 2,442 | 2,361 | 2,621 | 2,709 | 2,886 | 2,982 | 3,039 | 2,907 | 2,902 | 2,953 | 2,772 |
| 2017 | 2,891 | 2,703 | 2,259 | 2,118 | 2,016 | 2,215 | 2,069 | 2,173 | 1,681 | 1,475 | 1,285 | 1,436 |
| 2018 | 1,116 | 996 | 1,106 | 655 | 487 | 610 | 1,028 | 934 | 2,659 | 2,970 | 2,510 | 2,772 |
| 2019 | 3,206 | 2,742 | 2,076 | 1,657 | 1,479 | 1,958 | 2,860 | 3,735 | 2,916 | 2,763 | 3,392 | 2,730 |
| 2020 | 2,473 | 2,098 | 2,315 | 3,470 | 5,309 | 5,562 | 5,914 | 5,662 | 5,345 | 5,688 | 5,433 | 5,218 |
| 2021 | 4,595 | 3,667 | 3,386 | 2,555 | 2,067 | 2,306 | 2,330 | 2,764 | 2,377 | 2,359 | 2,535 | 2,666 |
| 2022 | 1,496 | 1,990 | 1,385 | 773 | 793 | 758 | 866 | 770 | 799 | 1,117 | 1,297 | 1,134 |
| 2023 | 1,670 | 1,502 | 1,197 | 1,257 | 1,047 | 1,095 | 993 | 916 | 974 | 912 | 905 | 1,326 |
| 2024 | 1,494 | |||||||||||
| - = No Data Reported; -- = Not Applicable; NA = Not Available; W = Withheld to avoid disclosure of individual company data. |
| Release Date: 3/29/2024 |
| Next Release Date: 4/30/2024 |