|
Download Data (XLS File) |
|
||||||||
|
||||||||
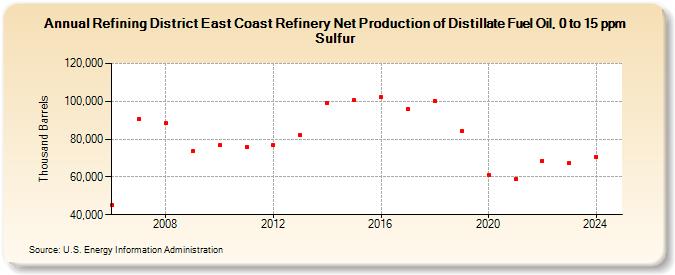
| Refining District East Coast Refinery Net Production of Distillate Fuel Oil, 0 to 15 ppm Sulfur (Thousand Barrels) | ||||||||
| Decade | Year-0 | Year-1 | Year-2 | Year-3 | Year-4 | Year-5 | Year-6 | Year-7 | Year-8 | Year-9 |
|---|---|---|---|---|---|---|---|---|---|---|
| 2000's | 45,000 | 90,800 | 88,360 | 73,469 | ||||||
| 2010's | 76,662 | 76,075 | 76,783 | 81,943 | 99,359 | 100,632 | 102,021 | 95,888 | 100,168 | 84,449 |
| 2020's | 61,079 | 59,016 | 68,557 | 67,397 |
| - = No Data Reported; -- = Not Applicable; NA = Not Available; W = Withheld to avoid disclosure of individual company data. |
| Release Date: 8/30/2024 |
| Next Release Date: 8/29/2025 |