|
Download Data (XLS File) |
|
||||||||
|
||||||||
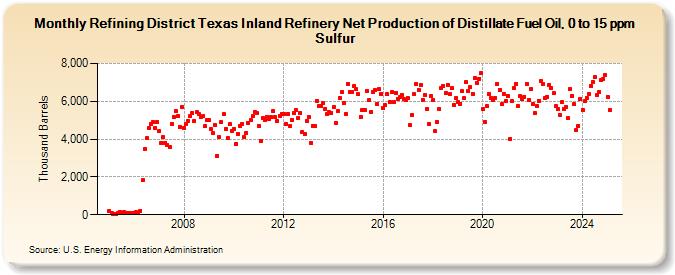
| Refining District Texas Inland Refinery Net Production of Distillate Fuel Oil, 0 to 15 ppm Sulfur (Thousand Barrels) | ||||||||
| Year | Jan | Feb | Mar | Apr | May | Jun | Jul | Aug | Sep | Oct | Nov | Dec |
|---|---|---|---|---|---|---|---|---|---|---|---|---|
| 2005 | 173 | 108 | 64 | 35 | 82 | 169 | 88 | 119 | 82 | 110 | 84 | 68 |
| 2006 | 94 | 129 | 93 | 214 | 1,813 | 3,456 | 4,043 | 4,570 | 4,802 | 4,883 | 4,590 | 4,902 |
| 2007 | 4,434 | 3,816 | 4,097 | 3,807 | 3,690 | 3,585 | 4,811 | 5,173 | 5,469 | 5,224 | 4,654 | 5,684 |
| 2008 | 4,584 | 4,813 | 4,968 | 5,232 | 5,377 | 4,937 | 5,417 | 5,325 | 5,186 | 5,199 | 4,668 | 4,999 |
| 2009 | 4,989 | 4,528 | 4,318 | 4,730 | 3,131 | 4,123 | 4,888 | 5,326 | 4,557 | 4,047 | 4,777 | 4,452 |
| 2010 | 4,554 | 3,752 | 4,288 | 4,710 | 4,816 | 4,109 | 4,311 | 4,874 | 4,987 | 5,217 | 5,435 | 5,369 |
| 2011 | 4,707 | 3,913 | 5,137 | 5,002 | 5,183 | 5,065 | 5,155 | 5,463 | 5,166 | 4,970 | 5,238 | 5,340 |
| 2012 | 5,350 | 4,812 | 5,342 | 4,681 | 5,031 | 5,400 | 5,535 | 5,129 | 5,369 | 4,385 | 4,260 | 4,979 |
| 2013 | 5,160 | 3,802 | 4,695 | 4,680 | 6,032 | 5,734 | 5,773 | 5,908 | 5,594 | 5,311 | 5,412 | 5,402 |
| 2014 | 5,720 | 4,857 | 5,486 | 6,179 | 6,482 | 5,900 | 5,344 | 6,915 | 6,499 | 6,504 | 6,800 | 6,634 |
| 2015 | 6,371 | 5,176 | 5,554 | 5,514 | 6,561 | 6,046 | 5,455 | 6,485 | 6,607 | 5,863 | 6,627 | 6,401 |
| 2016 | 5,647 | 5,795 | 6,369 | 5,970 | 6,476 | 5,970 | 6,450 | 6,141 | 6,239 | 6,358 | 6,141 | 6,051 |
| 2017 | 6,159 | 4,737 | 5,278 | 6,371 | 6,903 | 6,592 | 6,865 | 6,070 | 6,359 | 5,616 | 4,787 | 6,262 |
| 2018 | 6,061 | 4,415 | 4,920 | 5,585 | 6,687 | 6,796 | 6,425 | 6,865 | 6,373 | 6,678 | 5,811 | 6,162 |
| 2019 | 5,940 | 5,879 | 6,524 | 6,158 | 7,004 | 6,566 | 6,752 | 6,410 | 7,222 | 6,989 | 7,193 | 7,474 |
| 2020 | 5,618 | 4,919 | 5,731 | 6,373 | 6,157 | 6,051 | 6,194 | 6,913 | 6,611 | 5,843 | 6,400 | 6,023 |
| 2021 | 6,306 | 4,002 | 6,029 | 6,713 | 6,915 | 5,743 | 6,257 | 6,133 | 6,251 | 6,919 | 6,076 | 6,649 |
| 2022 | 5,861 | 5,365 | 5,750 | 6,032 | 7,058 | 6,916 | 6,186 | 6,247 | 6,859 | 6,692 | 6,430 | 5,728 |
| 2023 | 5,612 | 5,170 | 5,973 | 5,590 | 5,700 | 5,114 | 6,653 | 6,289 | 5,837 | 4,475 | 4,702 | 6,104 |
| 2024 | 5,535 | |||||||||||
| - = No Data Reported; -- = Not Applicable; NA = Not Available; W = Withheld to avoid disclosure of individual company data. |
| Release Date: 3/29/2024 |
| Next Release Date: 4/30/2024 |