|
Download Data (XLS File) |
|
||||||||
|
||||||||
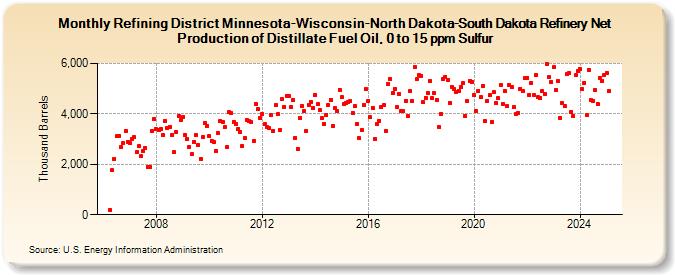
| Refining District Minnesota-Wisconsin-North Dakota-South Dakota Refinery Net Production of Distillate Fuel Oil, 0 to 15 ppm Sulfur (Thousand Barrels) | ||||||||
| Year | Jan | Feb | Mar | Apr | May | Jun | Jul | Aug | Sep | Oct | Nov | Dec |
|---|---|---|---|---|---|---|---|---|---|---|---|---|
| 2006 | 193 | 1,758 | 2,222 | 3,119 | 3,134 | 2,670 | 2,831 | 3,323 | 2,899 | |||
| 2007 | 2,829 | 3,007 | 3,068 | 2,472 | 2,717 | 2,319 | 2,539 | 2,654 | 1,897 | 1,890 | 3,302 | 3,787 |
| 2008 | 3,397 | 3,360 | 3,413 | 3,155 | 3,709 | 3,423 | 3,496 | 3,168 | 2,483 | 3,282 | 3,918 | 3,746 |
| 2009 | 3,879 | 3,147 | 2,991 | 2,697 | 2,406 | 2,895 | 3,149 | 2,760 | 2,222 | 3,084 | 3,635 | 3,536 |
| 2010 | 3,118 | 2,940 | 2,887 | 2,518 | 3,239 | 3,710 | 3,689 | 3,466 | 2,691 | 4,079 | 4,034 | 3,691 |
| 2011 | 3,610 | 3,420 | 3,278 | 2,719 | 3,041 | 3,765 | 3,707 | 3,674 | 2,933 | 4,387 | 4,192 | 3,822 |
| 2012 | 4,001 | 3,613 | 3,475 | 3,423 | 3,960 | 3,329 | 4,350 | 3,976 | 3,367 | 4,585 | 4,291 | 4,721 |
| 2013 | 4,691 | 4,277 | 4,544 | 3,045 | 2,611 | 3,856 | 4,307 | 4,100 | 3,339 | 4,362 | 4,486 | 4,252 |
| 2014 | 4,746 | 4,389 | 4,143 | 3,821 | 3,613 | 3,947 | 4,350 | 4,571 | 3,511 | 4,236 | 4,104 | 4,964 |
| 2015 | 4,655 | 4,384 | 4,438 | 4,484 | 4,492 | 4,051 | 4,295 | 3,601 | 3,028 | 3,352 | 4,363 | 4,985 |
| 2016 | 4,515 | 3,857 | 4,250 | 2,996 | 3,616 | 3,727 | 4,262 | 4,338 | 3,328 | 5,167 | 5,384 | 4,825 |
| 2017 | 4,998 | 4,259 | 4,790 | 4,119 | 4,096 | 4,530 | 3,922 | 4,894 | 4,518 | 5,866 | 5,379 | 5,541 |
| 2018 | 5,523 | 4,455 | 4,643 | 4,831 | 5,298 | 4,617 | 4,824 | 4,568 | 3,482 | 3,998 | 5,367 | 5,475 |
| 2019 | 5,346 | 4,435 | 5,069 | 4,975 | 4,872 | 4,924 | 5,053 | 5,213 | 3,934 | 4,499 | 5,318 | 5,278 |
| 2020 | 4,749 | 4,104 | 4,909 | 4,659 | 5,101 | 3,705 | 4,524 | 4,739 | 3,689 | 4,856 | 4,423 | 4,612 |
| 2021 | 5,137 | 4,406 | 4,905 | 4,297 | 5,146 | 5,051 | 4,261 | 4,010 | 4,041 | 5,003 | 4,917 | 5,416 |
| 2022 | 5,435 | 4,747 | 5,243 | 4,744 | 5,527 | 4,652 | 4,641 | 4,892 | 4,808 | 5,960 | 5,456 | 5,262 |
| 2023 | 5,847 | 4,955 | 5,307 | 3,849 | 4,425 | 4,313 | 5,566 | 5,621 | 4,089 | 3,918 | 5,529 | 5,707 |
| 2024 | 5,770 | |||||||||||
| - = No Data Reported; -- = Not Applicable; NA = Not Available; W = Withheld to avoid disclosure of individual company data. |
| Release Date: 3/29/2024 |
| Next Release Date: 4/30/2024 |