|
Download Data (XLS File) |
|
||||||||
|
||||||||
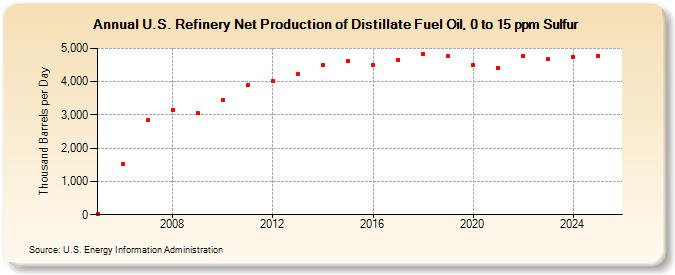
| U.S. Refinery Net Production of Distillate Fuel Oil, 0 to 15 ppm Sulfur (Thousand Barrels per Day) | ||||||||
| Decade | Year-0 | Year-1 | Year-2 | Year-3 | Year-4 | Year-5 | Year-6 | Year-7 | Year-8 | Year-9 |
|---|---|---|---|---|---|---|---|---|---|---|
| 2000's | 23 | 1,522 | 2,841 | 3,156 | 3,054 | |||||
| 2010's | 3,447 | 3,886 | 4,028 | 4,238 | 4,493 | 4,606 | 4,486 | 4,662 | 4,819 | 4,764 |
| 2020's | 4,496 | 4,422 | 4,757 | 4,675 |
| - = No Data Reported; -- = Not Applicable; NA = Not Available; W = Withheld to avoid disclosure of individual company data. |
| Release Date: 4/30/2024 |
| Next Release Date: 8/30/2024 |