|
Download Data (XLS File) |
|
||||||||
|
||||||||
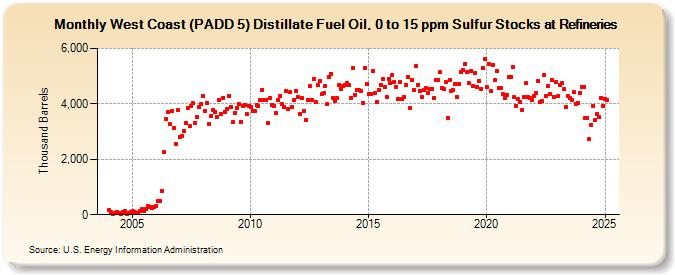
| West Coast (PADD 5) Distillate Fuel Oil, 0 to 15 ppm Sulfur Stocks at Refineries (Thousand Barrels) | ||||||||
| Year | Jan | Feb | Mar | Apr | May | Jun | Jul | Aug | Sep | Oct | Nov | Dec |
|---|---|---|---|---|---|---|---|---|---|---|---|---|
| 2004 | 158 | 104 | 23 | 46 | 97 | 77 | 13 | 97 | 129 | 36 | 57 | 104 |
| 2005 | 124 | 107 | 73 | 62 | 134 | 198 | 138 | 197 | 302 | 284 | 242 | 290 |
| 2006 | 321 | 510 | 479 | 854 | 2,246 | 3,464 | 3,695 | 3,261 | 3,743 | 3,143 | 2,557 | 3,785 |
| 2007 | 2,790 | 2,847 | 3,035 | 3,317 | 3,843 | 3,186 | 3,913 | 4,016 | 3,316 | 3,521 | 3,875 | 3,978 |
| 2008 | 4,270 | 3,755 | 4,036 | 3,261 | 3,564 | 3,788 | 3,722 | 3,535 | 4,140 | 3,638 | 4,223 | 3,708 |
| 2009 | 3,827 | 4,291 | 3,880 | 3,336 | 3,680 | 3,845 | 4,004 | 3,351 | 3,924 | 3,961 | 3,617 | 3,931 |
| 2010 | 3,887 | 3,758 | 3,735 | 3,950 | 3,919 | 4,146 | 4,512 | 4,125 | 4,149 | 3,322 | 4,202 | 3,947 |
| 2011 | 3,919 | 3,664 | 4,126 | 4,292 | 3,985 | 3,878 | 4,468 | 3,810 | 4,413 | 3,872 | 4,155 | 4,470 |
| 2012 | 4,251 | 3,648 | 4,198 | 3,725 | 3,431 | 4,142 | 4,629 | 4,156 | 4,896 | 4,052 | 4,686 | 4,814 |
| 2013 | 4,341 | 4,377 | 4,654 | 4,002 | 4,971 | 5,084 | 4,203 | 4,103 | 4,199 | 4,683 | 4,529 | 4,629 |
| 2014 | 4,673 | 4,756 | 4,681 | 4,206 | 5,291 | 4,334 | 4,514 | 4,488 | 4,448 | 4,030 | 5,298 | 4,713 |
| 2015 | 4,359 | 4,358 | 5,190 | 4,390 | 4,054 | 4,494 | 4,671 | 4,900 | 4,605 | 4,261 | 4,895 | 4,765 |
| 2016 | 5,048 | 4,805 | 4,613 | 4,175 | 4,804 | 4,168 | 4,243 | 4,663 | 4,970 | 3,836 | 4,865 | 4,492 |
| 2017 | 5,351 | 4,682 | 4,465 | 4,252 | 4,485 | 4,587 | 4,384 | 4,520 | 4,535 | 4,200 | 4,869 | 4,877 |
| 2018 | 5,131 | 4,575 | 4,532 | 4,795 | 3,501 | 4,876 | 4,463 | 4,507 | 4,718 | 4,256 | 4,726 | 5,153 |
| 2019 | 5,223 | 5,454 | 5,164 | 4,743 | 5,193 | 4,648 | 5,121 | 4,604 | 4,835 | 4,543 | 5,285 | 5,631 |
| 2020 | 4,596 | 5,441 | 4,455 | 5,393 | 4,871 | 5,183 | 4,588 | 4,588 | 4,358 | 4,200 | 4,336 | 4,954 |
| 2021 | 4,970 | 5,344 | 4,231 | 3,914 | 4,158 | 4,059 | 3,789 | 4,250 | 4,734 | 4,233 | 4,210 | 4,125 |
| 2022 | 4,266 | 4,384 | 4,825 | 4,075 | 4,117 | 5,044 | 4,297 | 4,633 | 4,372 | 4,869 | 4,254 | 4,779 |
| 2023 | 4,278 | 4,677 | 4,741 | 4,519 | 3,885 | 4,292 | 4,213 | 4,149 | 4,418 | 3,994 | 4,041 | 4,385 |
| 2024 | 4,618 | |||||||||||
| - = No Data Reported; -- = Not Applicable; NA = Not Available; W = Withheld to avoid disclosure of individual company data. |
| Release Date: 3/29/2024 |
| Next Release Date: 4/30/2024 |