|
Download Data (XLS File) |
|
||||||||
|
||||||||
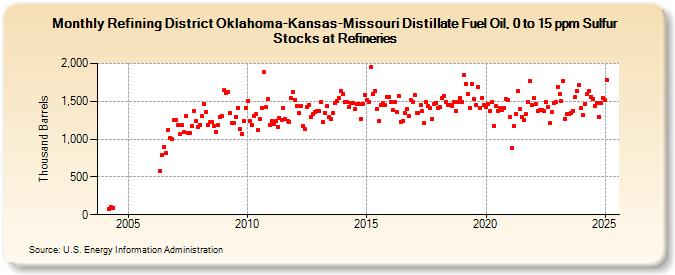
| Refining District Oklahoma-Kansas-Missouri Distillate Fuel Oil, 0 to 15 ppm Sulfur Stocks at Refineries (Thousand Barrels) | ||||||||
| Year | Jan | Feb | Mar | Apr | May | Jun | Jul | Aug | Sep | Oct | Nov | Dec |
|---|---|---|---|---|---|---|---|---|---|---|---|---|
| 2004 | 76 | 99 | 95 | |||||||||
| 2006 | 576 | 789 | 889 | 816 | 1,123 | 1,011 | 997 | 1,247 | ||||
| 2007 | 1,253 | 1,189 | 1,069 | 1,191 | 1,089 | 1,300 | 1,079 | 1,083 | 1,167 | 1,373 | 1,238 | 1,163 |
| 2008 | 1,191 | 1,300 | 1,462 | 1,363 | 1,190 | 1,222 | 1,226 | 1,176 | 1,096 | 1,180 | 1,291 | 1,311 |
| 2009 | 1,648 | 1,612 | 1,624 | 1,350 | 1,213 | 1,218 | 1,296 | 1,414 | 1,137 | 1,074 | 1,240 | 1,413 |
| 2010 | 1,499 | 1,235 | 1,189 | 1,301 | 1,327 | 1,120 | 1,272 | 1,405 | 1,885 | 1,418 | 1,524 | 1,192 |
| 2011 | 1,242 | 1,197 | 1,237 | 1,164 | 1,284 | 1,259 | 1,405 | 1,264 | 1,245 | 1,230 | 1,541 | 1,620 |
| 2012 | 1,521 | 1,440 | 1,344 | 1,444 | 1,175 | 1,127 | 1,422 | 1,454 | 1,287 | 1,334 | 1,358 | 1,366 |
| 2013 | 1,367 | 1,487 | 1,221 | 1,346 | 1,437 | 1,292 | 1,267 | 1,351 | 1,473 | 1,508 | 1,539 | 1,635 |
| 2014 | 1,592 | 1,484 | 1,486 | 1,431 | 1,479 | 1,482 | 1,395 | 1,470 | 1,460 | 1,267 | 1,469 | 1,579 |
| 2015 | 1,517 | 1,490 | 1,952 | 1,599 | 1,642 | 1,402 | 1,239 | 1,452 | 1,480 | 1,446 | 1,557 | 1,558 |
| 2016 | 1,497 | 1,383 | 1,497 | 1,353 | 1,575 | 1,227 | 1,235 | 1,346 | 1,398 | 1,302 | 1,513 | 1,495 |
| 2017 | 1,586 | 1,343 | 1,350 | 1,448 | 1,366 | 1,216 | 1,490 | 1,438 | 1,405 | 1,261 | 1,467 | 1,473 |
| 2018 | 1,412 | 1,420 | 1,548 | 1,568 | 1,490 | 1,456 | 1,455 | 1,442 | 1,493 | 1,370 | 1,487 | 1,544 |
| 2019 | 1,486 | 1,842 | 1,730 | 1,596 | 1,412 | 1,730 | 1,528 | 1,452 | 1,693 | 1,412 | 1,545 | 1,452 |
| 2020 | 1,431 | 1,469 | 1,372 | 1,489 | 1,179 | 1,444 | 1,376 | 1,416 | 1,380 | 1,406 | 1,533 | 1,520 |
| 2021 | 1,293 | 877 | 1,173 | 1,328 | 1,637 | 1,398 | 1,294 | 1,246 | 1,327 | 1,491 | 1,770 | 1,456 |
| 2022 | 1,538 | 1,464 | 1,366 | 1,382 | 1,390 | 1,368 | 1,490 | 1,431 | 1,210 | 1,359 | 1,478 | 1,492 |
| 2023 | 1,695 | 1,597 | 1,501 | 1,771 | 1,272 | 1,326 | 1,331 | 1,344 | 1,377 | 1,551 | 1,634 | 1,714 |
| 2024 | 1,407 | |||||||||||
| - = No Data Reported; -- = Not Applicable; NA = Not Available; W = Withheld to avoid disclosure of individual company data. |
| Release Date: 3/29/2024 |
| Next Release Date: 4/30/2024 |