|
Download Data (XLS File) |
|
||||||||
|
||||||||
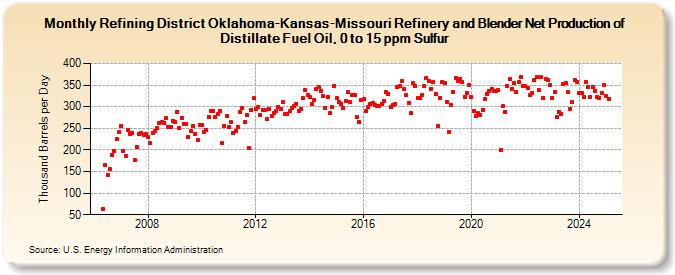
| Refining District Oklahoma-Kansas-Missouri Refinery and Blender Net Production of Distillate Fuel Oil, 0 to 15 ppm Sulfur (Thousand Barrels per Day) | ||||||||
| Year | Jan | Feb | Mar | Apr | May | Jun | Jul | Aug | Sep | Oct | Nov | Dec |
|---|---|---|---|---|---|---|---|---|---|---|---|---|
| 2006 | 64 | 165 | 143 | 155 | 188 | 197 | 225 | 242 | ||||
| 2007 | 256 | 198 | 186 | 247 | 237 | 239 | 176 | 207 | 237 | 240 | 235 | 236 |
| 2008 | 229 | 215 | 240 | 244 | 251 | 262 | 264 | 262 | 274 | 253 | 254 | 268 |
| 2009 | 265 | 288 | 251 | 274 | 260 | 261 | 230 | 243 | 256 | 237 | 224 | 258 |
| 2010 | 258 | 241 | 246 | 277 | 291 | 290 | 275 | 282 | 289 | 215 | 256 | 278 |
| 2011 | 252 | 264 | 239 | 243 | 253 | 287 | 296 | 265 | 281 | 204 | 293 | 320 |
| 2012 | 295 | 299 | 281 | 293 | 293 | 271 | 294 | 278 | 285 | 291 | 300 | 295 |
| 2013 | 310 | 283 | 282 | 289 | 296 | 301 | 307 | 290 | 295 | 319 | 339 | 327 |
| 2014 | 322 | 307 | 316 | 342 | 346 | 337 | 325 | 296 | 323 | 285 | 299 | 349 |
| 2015 | 320 | 312 | 307 | 297 | 314 | 333 | 312 | 327 | 328 | 276 | 265 | 315 |
| 2016 | 317 | 289 | 299 | 307 | 308 | 303 | 301 | 301 | 307 | 314 | 333 | 329 |
| 2017 | 300 | 305 | 306 | 345 | 348 | 359 | 340 | 326 | 309 | 285 | 354 | 347 |
| 2018 | 321 | 320 | 326 | 348 | 366 | 359 | 342 | 358 | 329 | 255 | 321 | 358 |
| 2019 | 354 | 311 | 241 | 303 | 334 | 366 | 359 | 363 | 357 | 323 | 331 | 350 |
| 2020 | 322 | 291 | 278 | 285 | 281 | 293 | 317 | 330 | 337 | 342 | 337 | 337 |
| 2021 | 338 | 200 | 301 | 288 | 348 | 364 | 342 | 354 | 335 | 357 | 368 | 347 |
| 2022 | 347 | 343 | 326 | 332 | 361 | 369 | 338 | 368 | 321 | 363 | 361 | 351 |
| 2023 | 321 | 335 | 275 | 288 | 283 | 353 | 354 | 333 | 295 | 310 | 362 | 358 |
| 2024 | 332 | 332 | 323 | 358 | 346 | 322 | ||||||
| - = No Data Reported; -- = Not Applicable; NA = Not Available; W = Withheld to avoid disclosure of individual company data. |
| Release Date: 8/30/2024 |
| Next Release Date: 9/30/2024 |