|
Download Data (XLS File) |
|
||||||||
|
||||||||
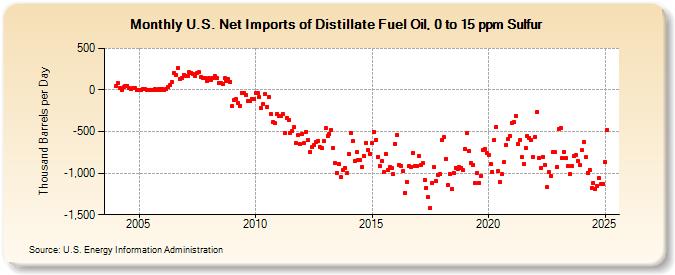
| U.S. Net Imports of Distillate Fuel Oil, 0 to 15 ppm Sulfur (Thousand Barrels per Day) | ||||||||
| Year | Jan | Feb | Mar | Apr | May | Jun | Jul | Aug | Sep | Oct | Nov | Dec |
|---|---|---|---|---|---|---|---|---|---|---|---|---|
| 2004 | 43 | 79 | 24 | 2 | 30 | 51 | 52 | 24 | 8 | 18 | 20 | 1 |
| 2005 | 2 | 1 | 13 | 8 | 1 | 1 | 1 | 1 | 10 | 2 | 8 | 3 |
| 2006 | 11 | 0 | 17 | 35 | 57 | 97 | 206 | 182 | 263 | 137 | 144 | 185 |
| 2007 | 171 | 169 | 214 | 210 | 191 | 163 | 210 | 212 | 160 | 143 | 143 | 111 |
| 2008 | 143 | 125 | 148 | 164 | 139 | 86 | 86 | 77 | 138 | 110 | 130 | 100 |
| 2009 | -195 | -115 | -114 | -159 | -188 | -31 | -37 | -60 | -136 | -136 | -113 | -106 |
| 2010 | -31 | -42 | -89 | -221 | -169 | -51 | -199 | -84 | -290 | -387 | -401 | -286 |
| 2011 | -317 | -315 | -283 | -518 | -335 | -361 | -520 | -494 | -449 | -643 | -543 | -654 |
| 2012 | -528 | -638 | -500 | -603 | -743 | -687 | -666 | -630 | -612 | -689 | -701 | -619 |
| 2013 | -463 | -551 | -526 | -483 | -692 | -877 | -1,001 | -894 | -1,046 | -964 | -935 | -1,001 |
| 2014 | -772 | -518 | -614 | -860 | -751 | -840 | -844 | -927 | -792 | -634 | -726 | -771 |
| 2015 | -640 | -507 | -601 | -802 | -916 | -853 | -987 | -765 | -961 | -927 | -942 | -1,016 |
| 2016 | -644 | -541 | -901 | -913 | -979 | -1,235 | -1,102 | -918 | -929 | -757 | -915 | -910 |
| 2017 | -796 | -898 | -881 | -1,077 | -1,178 | -1,288 | -1,416 | -1,117 | -926 | -1,100 | -1,018 | -1,011 |
| 2018 | -601 | -563 | -826 | -1,143 | -1,008 | -1,188 | -993 | -938 | -949 | -926 | -935 | -964 |
| 2019 | -711 | -516 | -739 | -873 | -899 | -1,113 | -999 | -1,114 | -1,035 | -722 | -711 | -762 |
| 2020 | -787 | -890 | -986 | -600 | -444 | -978 | -1,108 | -1,014 | -864 | -661 | -587 | -551 |
| 2021 | -398 | -388 | -307 | -646 | -605 | -810 | -889 | -695 | -554 | -573 | -601 | -804 |
| 2022 | -561 | -264 | -820 | -938 | -803 | -906 | -1,170 | -986 | -1,032 | -746 | -741 | -926 |
| 2023 | -508 | -456 | -811 | -733 | -826 | -923 | -950 | -842 | -783 | -771 | -822 | -945 |
| 2024 | -727 | |||||||||||
| - = No Data Reported; -- = Not Applicable; NA = Not Available; W = Withheld to avoid disclosure of individual company data. |
| Release Date: 3/29/2024 |
| Next Release Date: 4/30/2024 |