|
Download Data (XLS File) |
|
||||||||
|
||||||||
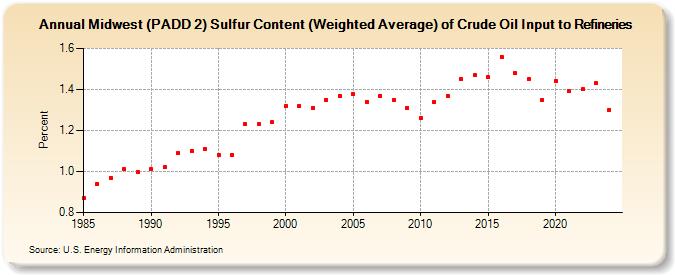
| Midwest (PADD 2) Sulfur Content (Weighted Average) of Crude Oil Input to Refineries (Percent) | ||||||||
| Decade | Year-0 | Year-1 | Year-2 | Year-3 | Year-4 | Year-5 | Year-6 | Year-7 | Year-8 | Year-9 |
|---|---|---|---|---|---|---|---|---|---|---|
| 1980's | 0.87 | 0.94 | 0.97 | 1.01 | 1.00 | |||||
| 1990's | 1.01 | 1.02 | 1.09 | 1.10 | 1.11 | 1.08 | 1.08 | 1.23 | 1.23 | 1.24 |
| 2000's | 1.32 | 1.32 | 1.31 | 1.35 | 1.37 | 1.38 | 1.34 | 1.37 | 1.35 | 1.31 |
| 2010's | 1.26 | 1.34 | 1.37 | 1.45 | 1.47 | 1.46 | 1.56 | 1.48 | 1.45 | 1.35 |
| 2020's | 1.44 | 1.39 | 1.40 | 1.43 |
| - = No Data Reported; -- = Not Applicable; NA = Not Available; W = Withheld to avoid disclosure of individual company data. |
| Release Date: 3/29/2024 |
| Next Release Date: 8/30/2024 |