|
Download Data (XLS File) |
|
||||||||
|
||||||||
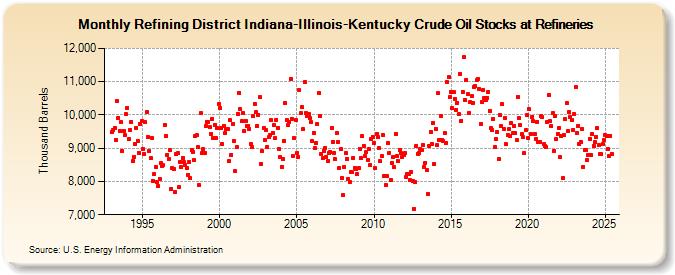
| Refining District Indiana-Illinois-Kentucky Crude Oil Stocks at Refineries (Thousand Barrels) | ||||||||
| Year | Jan | Feb | Mar | Apr | May | Jun | Jul | Aug | Sep | Oct | Nov | Dec |
|---|---|---|---|---|---|---|---|---|---|---|---|---|
| 1993 | 9,482 | 9,534 | 9,619 | 9,247 | 10,412 | 9,915 | 9,512 | 9,778 | 8,929 | 9,524 | 9,393 | 10,014 |
| 1994 | 10,217 | 9,282 | 9,547 | 9,800 | 8,615 | 8,741 | 9,128 | 9,616 | 9,230 | 8,867 | 9,735 | 9,806 |
| 1995 | 8,977 | 8,821 | 9,777 | 10,076 | 9,343 | 8,908 | 8,693 | 9,308 | 8,013 | 8,219 | 8,448 | 7,987 |
| 1996 | 7,869 | 8,087 | 8,545 | 8,458 | 8,482 | 9,697 | 9,375 | 8,800 | 8,672 | 8,935 | 7,781 | 8,398 |
| 1997 | 8,374 | 7,692 | 8,838 | 8,849 | 7,824 | 8,599 | 8,422 | 8,711 | 8,581 | 8,493 | 8,392 | 8,206 |
| 1998 | 8,591 | 8,091 | 8,939 | 8,893 | 8,651 | 9,353 | 9,386 | 9,032 | 7,881 | 10,046 | 8,843 | 8,964 |
| 1999 | 8,846 | 9,668 | 9,795 | 9,786 | 9,633 | 9,434 | 9,887 | 9,294 | 9,702 | 9,306 | 9,612 | 10,330 |
| 2000 | 10,221 | 9,599 | 9,125 | 9,673 | 9,455 | 9,576 | 9,563 | 8,606 | 9,840 | 8,796 | 9,742 | 9,219 |
| 2001 | 8,303 | 9,024 | 10,042 | 10,668 | 10,168 | 9,808 | 10,055 | 9,524 | 9,821 | 9,669 | 9,668 | 9,582 |
| 2002 | 9,121 | 9,028 | 9,962 | 10,337 | 10,078 | 9,679 | 10,011 | 10,540 | 8,537 | 8,918 | 9,609 | 9,241 |
| 2003 | 9,538 | 9,033 | 9,323 | 9,406 | 9,836 | 9,469 | 9,687 | 9,297 | 9,862 | 9,608 | 8,982 | 8,722 |
| 2004 | 8,449 | 8,678 | 9,229 | 10,363 | 9,840 | 9,684 | 9,787 | 11,084 | 9,891 | 8,760 | 9,292 | 9,845 |
| 2005 | 8,848 | 8,746 | 10,735 | 10,045 | 10,232 | 9,566 | 10,998 | 10,057 | 9,969 | 10,021 | 9,896 | 9,779 |
| 2006 | 9,210 | 9,457 | 8,999 | 9,159 | 9,734 | 10,655 | 9,961 | 8,833 | 8,696 | 8,917 | 9,019 | 8,736 |
| 2007 | 8,607 | 8,862 | 8,874 | 9,617 | 9,196 | 8,868 | 8,667 | 9,449 | 9,196 | 8,411 | 8,967 | 8,104 |
| 2008 | 7,578 | 8,421 | 8,848 | 8,688 | 8,080 | 7,986 | 8,292 | 8,271 | 8,713 | 8,409 | 8,374 | 8,231 |
| 2009 | 8,400 | 8,983 | 8,696 | 9,355 | 9,075 | 8,758 | 8,888 | 8,641 | 8,971 | 8,482 | 9,287 | 9,348 |
| 2010 | 9,147 | 8,403 | 9,412 | 9,335 | 9,012 | 8,600 | 8,762 | 9,398 | 8,172 | 7,887 | 8,150 | 9,154 |
| 2011 | 8,851 | 8,045 | 8,554 | 8,745 | 8,424 | 9,419 | 8,753 | 8,608 | 8,954 | 8,842 | 8,736 | 8,792 |
| 2012 | 8,854 | 8,132 | 8,216 | 8,227 | 8,043 | 8,278 | 8,006 | 7,182 | 7,979 | 9,072 | 8,840 | 8,842 |
| 2013 | 8,966 | 8,953 | 9,105 | 8,438 | 8,567 | 8,333 | 7,619 | 9,076 | 9,500 | 9,126 | 9,767 | 8,532 |
| 2014 | 9,590 | 9,084 | 10,648 | 9,247 | 9,971 | 9,249 | 9,227 | 9,455 | 9,168 | 10,975 | 11,132 | 10,537 |
| 2015 | 10,684 | 10,202 | 10,677 | 10,493 | 10,162 | 10,372 | 10,021 | 11,244 | 9,828 | 10,703 | 11,727 | 10,455 |
| 2016 | 11,061 | 10,619 | 10,065 | 10,379 | 10,564 | 10,352 | 10,844 | 10,858 | 11,037 | 11,087 | 10,779 | 9,722 |
| 2017 | 10,395 | 10,748 | 10,521 | 10,440 | 10,522 | 10,697 | 10,128 | 9,598 | 9,551 | 9,873 | 9,023 | 9,268 |
| 2018 | 9,483 | 8,670 | 9,992 | 9,671 | 10,323 | 9,591 | 9,912 | 9,121 | 9,411 | 9,567 | 9,363 | 9,745 |
| 2019 | 9,455 | 9,661 | 9,453 | 9,236 | 10,548 | 9,895 | 9,689 | 9,413 | 9,322 | 8,854 | 9,533 | 9,987 |
| 2020 | 9,298 | 10,169 | 9,431 | 9,943 | 9,815 | 9,435 | 9,285 | 9,799 | 9,198 | 9,195 | 9,960 | 9,933 |
| 2021 | 9,111 | 9,066 | 9,021 | 9,781 | 10,592 | 9,805 | 9,669 | 10,055 | 8,923 | 9,963 | 9,266 | 9,439 |
| 2022 | 9,613 | 8,728 | 9,354 | 8,093 | 9,399 | 9,871 | 10,347 | 9,527 | 10,097 | 9,933 | 9,835 | 9,555 |
| 2023 | 9,842 | 10,676 | 9,288 | 9,526 | 9,000 | 9,027 | 9,381 | 8,277 | 8,797 | 8,771 | 8,461 | 8,808 |
| 2024 | 9,290 | |||||||||||
| - = No Data Reported; -- = Not Applicable; NA = Not Available; W = Withheld to avoid disclosure of individual company data. |
| Release Date: 3/29/2024 |
| Next Release Date: 4/30/2024 |