|
Download Data (XLS File) |
|
||||||||
|
||||||||
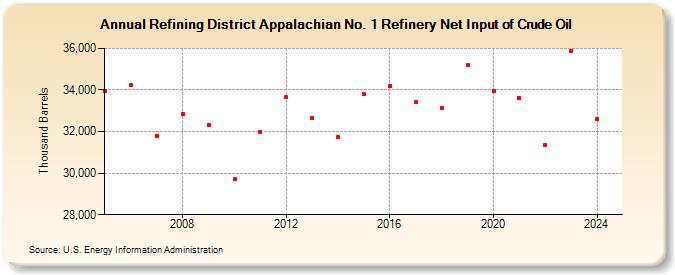
| Refining District Appalachian No. 1 Refinery Net Input of Crude Oil (Thousand Barrels) | ||||||||
| Decade | Year-0 | Year-1 | Year-2 | Year-3 | Year-4 | Year-5 | Year-6 | Year-7 | Year-8 | Year-9 |
|---|---|---|---|---|---|---|---|---|---|---|
| 2000's | 33,968 | 34,237 | 31,781 | 32,840 | 32,303 | |||||
| 2010's | 29,721 | 32,002 | 33,648 | 32,633 | 31,715 | 33,817 | 34,186 | 33,403 | 33,133 | 35,201 |
| 2020's | 33,944 | 33,599 | 31,359 | 35,889 | 32,599 |
| - = No Data Reported; -- = Not Applicable; NA = Not Available; W = Withheld to avoid disclosure of individual company data. |
| Release Date: 6/30/2025 |
| Next Release Date: 8/29/2025 |
Referring Pages: