|
Download Data (XLS File) |
|
||||||||
|
||||||||
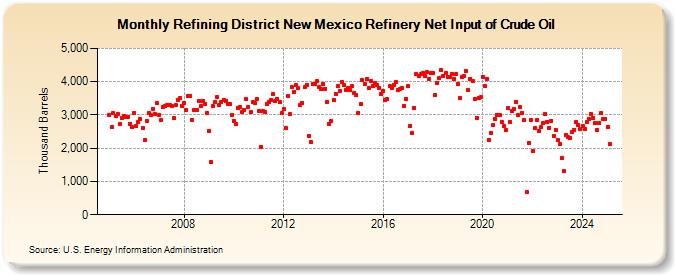
| Refining District New Mexico Refinery Net Input of Crude Oil (Thousand Barrels) | ||||||||
| Year | Jan | Feb | Mar | Apr | May | Jun | Jul | Aug | Sep | Oct | Nov | Dec |
|---|---|---|---|---|---|---|---|---|---|---|---|---|
| 2005 | 2,992 | 2,625 | 3,062 | 2,953 | 3,020 | 2,722 | 2,906 | 2,970 | 2,924 | 2,949 | 2,737 | 2,635 |
| 2006 | 3,071 | 2,666 | 2,788 | 2,869 | 2,609 | 2,236 | 2,825 | 3,063 | 2,988 | 3,183 | 3,041 | 3,350 |
| 2007 | 3,002 | 2,851 | 3,253 | 3,278 | 3,286 | 3,286 | 3,283 | 2,903 | 3,305 | 3,462 | 3,503 | 3,279 |
| 2008 | 3,363 | 3,148 | 3,578 | 3,573 | 2,841 | 3,134 | 3,147 | 3,417 | 3,258 | 3,426 | 3,330 | 3,066 |
| 2009 | 2,523 | 1,597 | 3,275 | 3,390 | 3,545 | 3,305 | 3,400 | 3,460 | 3,411 | 3,338 | 3,316 | 3,003 |
| 2010 | 2,828 | 2,729 | 3,216 | 3,252 | 3,083 | 3,135 | 3,469 | 3,253 | 3,084 | 3,382 | 3,352 | 3,486 |
| 2011 | 3,111 | 2,039 | 3,126 | 3,098 | 3,332 | 3,374 | 3,449 | 3,631 | 3,426 | 3,480 | 3,377 | 3,055 |
| 2012 | 3,176 | 2,601 | 3,570 | 3,015 | 3,837 | 3,701 | 3,893 | 3,809 | 3,310 | 3,363 | 3,831 | 3,905 |
| 2013 | 2,372 | 2,179 | 3,936 | 3,931 | 4,010 | 3,829 | 3,782 | 3,939 | 3,793 | 3,400 | 2,734 | 2,814 |
| 2014 | 3,463 | 3,642 | 3,866 | 3,722 | 3,985 | 3,888 | 3,757 | 3,823 | 3,741 | 3,857 | 3,671 | 3,602 |
| 2015 | 3,058 | 3,335 | 4,049 | 3,919 | 4,076 | 3,805 | 4,017 | 3,874 | 3,959 | 3,900 | 3,823 | 3,637 |
| 2016 | 3,731 | 3,453 | 3,481 | 3,856 | 3,801 | 3,903 | 3,989 | 3,748 | 3,778 | 3,811 | 3,271 | 3,485 |
| 2017 | 3,859 | 2,668 | 2,452 | 3,219 | 4,225 | 4,173 | 4,220 | 4,264 | 4,155 | 4,281 | 4,084 | 4,251 |
| 2018 | 4,251 | 3,607 | 3,947 | 4,100 | 4,361 | 4,172 | 4,260 | 4,143 | 4,144 | 4,221 | 4,084 | 4,226 |
| 2019 | 3,918 | 3,512 | 4,142 | 4,164 | 4,320 | 3,735 | 4,091 | 4,017 | 3,485 | 2,918 | 3,503 | 3,534 |
| 2020 | 4,147 | 3,878 | 4,087 | 2,254 | 2,460 | 2,695 | 2,887 | 3,010 | 2,996 | 2,802 | 2,658 | 2,553 |
| 2021 | 3,206 | 2,780 | 3,116 | 3,190 | 3,393 | 2,993 | 3,228 | 3,064 | 2,842 | 679 | 2,162 | 2,858 |
| 2022 | 1,911 | 2,592 | 2,841 | 2,514 | 2,630 | 2,752 | 3,042 | 2,788 | 2,621 | 2,824 | 2,368 | 2,561 |
| 2023 | 2,244 | 2,117 | 1,704 | 1,302 | 2,405 | 2,326 | 2,316 | 2,498 | 2,561 | 2,782 | 2,711 | 2,579 |
| 2024 | 2,663 | 2,574 | 2,792 | 2,874 | ||||||||
| - = No Data Reported; -- = Not Applicable; NA = Not Available; W = Withheld to avoid disclosure of individual company data. |
| Release Date: 6/28/2024 |
| Next Release Date: 7/31/2024 |
Referring Pages: