|
Download Data (XLS File) |
|
||||||||
|
||||||||
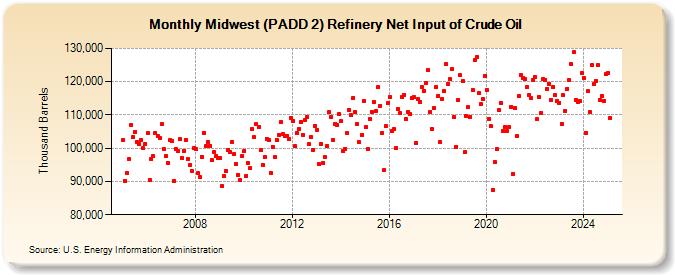
| Midwest (PADD 2) Refinery Net Input of Crude Oil (Thousand Barrels) | ||||||||
| Year | Jan | Feb | Mar | Apr | May | Jun | Jul | Aug | Sep | Oct | Nov | Dec |
|---|---|---|---|---|---|---|---|---|---|---|---|---|
| 2005 | 102,435 | 90,194 | 92,523 | 96,696 | 107,034 | 103,310 | 104,943 | 101,774 | 101,231 | 102,439 | 99,935 | 101,367 |
| 2006 | 104,521 | 90,501 | 96,807 | 97,571 | 104,557 | 103,717 | 103,159 | 107,134 | 99,771 | 97,578 | 95,610 | 102,312 |
| 2007 | 102,168 | 90,138 | 99,728 | 99,259 | 102,629 | 97,117 | 99,300 | 102,554 | 96,647 | 94,953 | 93,188 | 99,934 |
| 2008 | 99,612 | 92,462 | 91,248 | 97,447 | 104,661 | 100,779 | 101,800 | 100,781 | 96,380 | 98,907 | 97,769 | 97,015 |
| 2009 | 96,921 | 88,608 | 91,590 | 93,231 | 99,593 | 98,952 | 101,897 | 98,196 | 95,238 | 92,010 | 90,433 | 97,720 |
| 2010 | 99,184 | 91,717 | 95,614 | 93,994 | 105,719 | 103,253 | 107,177 | 106,469 | 99,368 | 94,946 | 97,325 | 102,911 |
| 2011 | 102,491 | 92,559 | 100,459 | 97,215 | 102,588 | 104,065 | 107,810 | 104,162 | 103,775 | 103,671 | 102,654 | 109,175 |
| 2012 | 108,247 | 100,557 | 104,646 | 105,817 | 107,901 | 103,987 | 108,462 | 109,339 | 101,146 | 103,356 | 99,582 | 106,786 |
| 2013 | 105,564 | 95,098 | 101,355 | 95,632 | 97,233 | 100,703 | 110,793 | 109,491 | 102,476 | 107,377 | 107,082 | 110,247 |
| 2014 | 108,047 | 99,075 | 99,778 | 104,466 | 111,415 | 109,863 | 115,223 | 110,791 | 107,127 | 101,768 | 103,976 | 114,244 |
| 2015 | 106,293 | 99,743 | 108,900 | 110,992 | 113,904 | 111,139 | 118,280 | 112,781 | 104,493 | 93,315 | 106,601 | 113,496 |
| 2016 | 115,438 | 105,169 | 105,672 | 100,007 | 111,828 | 110,479 | 115,425 | 116,117 | 108,732 | 110,888 | 110,228 | 115,145 |
| 2017 | 115,384 | 101,597 | 114,641 | 114,023 | 118,383 | 117,307 | 119,644 | 123,424 | 110,971 | 105,756 | 112,056 | 118,372 |
| 2018 | 115,808 | 101,857 | 114,873 | 117,135 | 125,381 | 119,361 | 120,652 | 123,851 | 109,414 | 100,442 | 114,588 | 121,859 |
| 2019 | 120,238 | 98,749 | 109,578 | 112,300 | 109,421 | 117,498 | 126,585 | 127,293 | 116,636 | 113,258 | 114,679 | 121,730 |
| 2020 | 117,548 | 108,849 | 106,648 | 87,405 | 95,814 | 99,667 | 111,416 | 113,605 | 105,215 | 106,378 | 105,090 | 106,235 |
| 2021 | 112,467 | 92,328 | 112,124 | 103,620 | 115,634 | 122,067 | 121,182 | 120,676 | 118,360 | 116,032 | 115,010 | 120,439 |
| 2022 | 121,369 | 108,695 | 115,295 | 110,541 | 120,848 | 120,595 | 117,910 | 119,440 | 114,616 | 118,356 | 115,856 | 114,315 |
| 2023 | 113,697 | 107,387 | 115,973 | 111,324 | 117,936 | 120,442 | 125,149 | 128,872 | 114,468 | 113,984 | 114,217 | 122,474 |
| 2024 | 121,137 | 104,713 | 117,115 | 110,822 | ||||||||
| - = No Data Reported; -- = Not Applicable; NA = Not Available; W = Withheld to avoid disclosure of individual company data. |
| Release Date: 6/28/2024 |
| Next Release Date: 7/31/2024 |
Referring Pages: