|
Download Data (XLS File) |
|
||||||||
|
||||||||
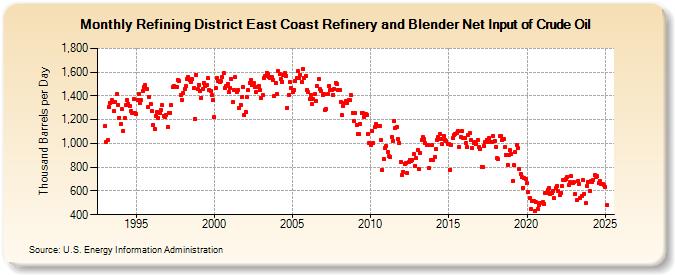
| Refining District East Coast Refinery and Blender Net Input of Crude Oil (Thousand Barrels per Day) | ||||||||
| Year | Jan | Feb | Mar | Apr | May | Jun | Jul | Aug | Sep | Oct | Nov | Dec |
|---|---|---|---|---|---|---|---|---|---|---|---|---|
| 1993 | 1,147 | 1,015 | 1,029 | 1,307 | 1,344 | 1,367 | 1,349 | 1,270 | 1,347 | 1,414 | 1,325 | 1,218 |
| 1994 | 1,161 | 1,286 | 1,107 | 1,214 | 1,321 | 1,367 | 1,335 | 1,313 | 1,272 | 1,254 | 1,370 | 1,258 |
| 1995 | 1,250 | 1,366 | 1,419 | 1,340 | 1,362 | 1,442 | 1,477 | 1,489 | 1,455 | 1,306 | 1,391 | 1,332 |
| 1996 | 1,275 | 1,155 | 1,124 | 1,230 | 1,267 | 1,216 | 1,256 | 1,284 | 1,321 | 1,232 | 1,222 | 1,242 |
| 1997 | 1,137 | 1,259 | 1,259 | 1,322 | 1,471 | 1,483 | 1,476 | 1,474 | 1,533 | 1,528 | 1,406 | 1,369 |
| 1998 | 1,421 | 1,460 | 1,480 | 1,544 | 1,563 | 1,531 | 1,519 | 1,539 | 1,463 | 1,209 | 1,580 | 1,455 |
| 1999 | 1,494 | 1,439 | 1,385 | 1,459 | 1,511 | 1,482 | 1,490 | 1,548 | 1,453 | 1,440 | 1,404 | 1,362 |
| 2000 | 1,220 | 1,463 | 1,548 | 1,524 | 1,518 | 1,522 | 1,558 | 1,590 | 1,470 | 1,481 | 1,500 | 1,430 |
| 2001 | 1,468 | 1,539 | 1,347 | 1,452 | 1,557 | 1,435 | 1,450 | 1,296 | 1,327 | 1,388 | 1,473 | 1,239 |
| 2002 | 1,265 | 1,387 | 1,446 | 1,511 | 1,532 | 1,492 | 1,509 | 1,473 | 1,436 | 1,476 | 1,486 | 1,446 |
| 2003 | 1,381 | 1,404 | 1,550 | 1,565 | 1,595 | 1,581 | 1,562 | 1,547 | 1,558 | 1,537 | 1,403 | 1,505 |
| 2004 | 1,415 | 1,606 | 1,582 | 1,543 | 1,520 | 1,575 | 1,594 | 1,571 | 1,301 | 1,410 | 1,516 | 1,465 |
| 2005 | 1,434 | 1,452 | 1,523 | 1,549 | 1,606 | 1,554 | 1,576 | 1,519 | 1,623 | 1,550 | 1,569 | 1,448 |
| 2006 | 1,432 | 1,370 | 1,409 | 1,332 | 1,371 | 1,416 | 1,359 | 1,480 | 1,541 | 1,455 | 1,442 | 1,408 |
| 2007 | 1,413 | 1,282 | 1,286 | 1,412 | 1,487 | 1,447 | 1,451 | 1,411 | 1,457 | 1,512 | 1,501 | 1,448 |
| 2008 | 1,447 | 1,350 | 1,238 | 1,319 | 1,342 | 1,353 | 1,344 | 1,369 | 1,363 | 1,404 | 1,260 | 1,191 |
| 2009 | 1,260 | 1,157 | 1,076 | 1,079 | 1,166 | 1,260 | 1,253 | 1,226 | 1,244 | 1,242 | 1,079 | 1,007 |
| 2010 | 984 | 1,102 | 1,006 | 1,135 | 1,166 | 1,144 | 1,143 | 1,144 | 1,026 | 775 | 866 | 958 |
| 2011 | 977 | 924 | 891 | 887 | 1,051 | 1,020 | 1,191 | 1,128 | 1,141 | 1,037 | 1,005 | 847 |
| 2012 | 734 | 762 | 825 | 834 | 748 | 841 | 864 | 849 | 862 | 909 | 811 | 878 |
| 2013 | 948 | 782 | 923 | 1,027 | 1,050 | 1,036 | 1,001 | 983 | 987 | 790 | 858 | 984 |
| 2014 | 863 | 887 | 949 | 1,025 | 1,055 | 1,077 | 1,038 | 995 | 1,063 | 1,032 | 1,019 | 996 |
| 2015 | 996 | 780 | 989 | 1,044 | 1,068 | 1,076 | 1,086 | 1,103 | 974 | 1,055 | 1,104 | 1,049 |
| 2016 | 1,042 | 1,002 | 968 | 1,075 | 1,087 | 1,026 | 964 | 1,001 | 1,010 | 999 | 1,032 | 969 |
| 2017 | 953 | 804 | 798 | 982 | 1,016 | 1,031 | 1,009 | 1,043 | 1,008 | 1,008 | 1,065 | 1,022 |
| 2018 | 974 | 875 | 867 | 1,059 | 1,060 | 1,028 | 1,039 | 969 | 906 | 821 | 906 | 946 |
| 2019 | 914 | 681 | 816 | 929 | 989 | 960 | 786 | 746 | 721 | 628 | 709 | 704 |
| 2020 | 666 | 593 | 541 | 445 | 512 | 512 | 429 | 504 | 449 | 480 | 501 | 502 |
| 2021 | 505 | 493 | 581 | 579 | 608 | 627 | 574 | 583 | 603 | 537 | 628 | 640 |
| 2022 | 598 | 564 | 586 | 640 | 690 | 693 | 702 | 721 | 653 | 679 | 722 | 668 |
| 2023 | 674 | 573 | 520 | 683 | 659 | 543 | 561 | 690 | 578 | 498 | 641 | 679 |
| 2024 | 600 | 684 | 677 | 690 | ||||||||
| - = No Data Reported; -- = Not Applicable; NA = Not Available; W = Withheld to avoid disclosure of individual company data. |
| Release Date: 6/28/2024 |
| Next Release Date: 7/31/2024 |