|
Download Data (XLS File) |
|
||||||||
|
||||||||
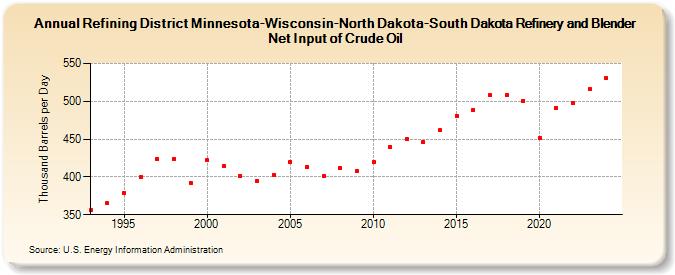
| Refining District Minnesota-Wisconsin-North Dakota-South Dakota Refinery and Blender Net Input of Crude Oil (Thousand Barrels per Day) | ||||||||
| Decade | Year-0 | Year-1 | Year-2 | Year-3 | Year-4 | Year-5 | Year-6 | Year-7 | Year-8 | Year-9 |
|---|---|---|---|---|---|---|---|---|---|---|
| 1990's | 356 | 365 | 379 | 400 | 424 | 424 | 392 | |||
| 2000's | 422 | 414 | 401 | 395 | 403 | 420 | 413 | 401 | 412 | 408 |
| 2010's | 420 | 440 | 450 | 446 | 462 | 481 | 489 | 508 | 508 | 501 |
| 2020's | 451 | 491 | 498 | 516 |
| - = No Data Reported; -- = Not Applicable; NA = Not Available; W = Withheld to avoid disclosure of individual company data. |
| Release Date: 8/30/2024 |
| Next Release Date: 8/29/2025 |