|
Download Data (XLS File) |
|
||||||||
|
||||||||
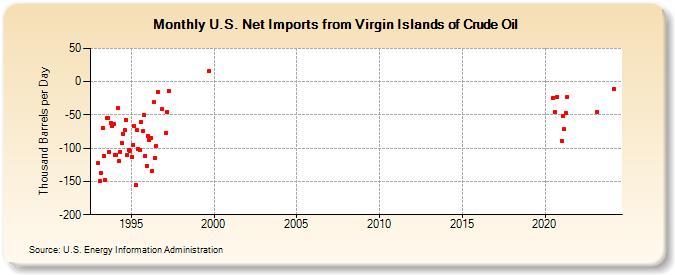
| U.S. Net Imports from Virgin Islands of Crude Oil (Thousand Barrels per Day) | ||||||||
| Year | Jan | Feb | Mar | Apr | May | Jun | Jul | Aug | Sep | Oct | Nov | Dec |
|---|---|---|---|---|---|---|---|---|---|---|---|---|
| 1993 | -123 | -150 | -137 | -70 | -111 | -148 | -54 | -55 | -106 | -62 | -67 | -63 |
| 1994 | -110 | -110 | -40 | -120 | -105 | -92 | -78 | -72 | -57 | -110 | -102 | -104 |
| 1995 | -113 | -95 | -67 | -155 | -73 | -101 | -103 | -61 | -74 | -50 | -111 | -127 |
| 1996 | -81 | -87 | -84 | -134 | -31 | -115 | -97 | -15 | -41 | |||
| 1997 | -77 | -45 | -14 | |||||||||
| 1999 | 16 | |||||||||||
| 2020 | -24 | -45 | -23 | |||||||||
| 2021 | -89 | -51 | -71 | -47 | -23 | |||||||
| 2023 | -45 | |||||||||||
| 2024 | -11 | |||||||||||
| - = No Data Reported; -- = Not Applicable; NA = Not Available; W = Withheld to avoid disclosure of individual company data. |
| Release Date: 6/30/2025 |
| Next Release Date: 7/31/2025 |