|
Download Data (XLS File) |
|
||||||||
|
||||||||
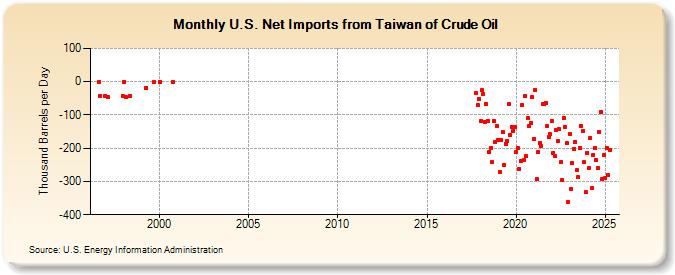
| U.S. Net Imports from Taiwan of Crude Oil (Thousand Barrels per Day) | ||||||||
| Year | Jan | Feb | Mar | Apr | May | Jun | Jul | Aug | Sep | Oct | Nov | Dec |
|---|---|---|---|---|---|---|---|---|---|---|---|---|
| 1996 | 0 | -43 | -42 | |||||||||
| 1997 | -46 | -42 | ||||||||||
| 1998 | 0 | -46 | -42 | |||||||||
| 1999 | -18 | 0 | ||||||||||
| 2000 | 0 | 0 | ||||||||||
| 2017 | -34 | -70 | -52 | |||||||||
| 2018 | -118 | -26 | -37 | -120 | -67 | -117 | -211 | -198 | -242 | -119 | -182 | -133 |
| 2019 | -176 | -271 | -176 | -152 | -250 | -186 | -177 | -67 | -160 | -135 | -148 | -135 |
| 2020 | -210 | -198 | -262 | -238 | -70 | -237 | -44 | -224 | -110 | -134 | -125 | -47 |
| 2021 | -171 | -25 | -292 | -211 | -185 | -193 | -68 | -66 | -64 | -132 | -167 | -158 |
| 2022 | -117 | -213 | -223 | -144 | -179 | -142 | -243 | -295 | -109 | -135 | -185 | -361 |
| 2023 | -179 | -227 | -244 | -201 | -182 | -359 | -199 | -198 | -133 | -147 | -271 | -304 |
| 2024 | -214 | |||||||||||
| - = No Data Reported; -- = Not Applicable; NA = Not Available; W = Withheld to avoid disclosure of individual company data. |
| Release Date: 3/29/2024 |
| Next Release Date: 4/30/2024 |