|
Download Data (XLS File) |
|
||||||||
|
||||||||
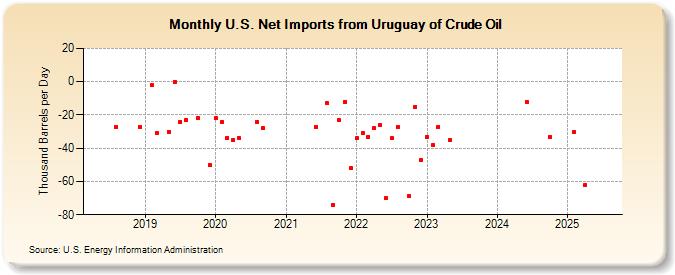
| U.S. Net Imports from Uruguay of Crude Oil (Thousand Barrels per Day) | ||||||||
| Year | Jan | Feb | Mar | Apr | May | Jun | Jul | Aug | Sep | Oct | Nov | Dec |
|---|---|---|---|---|---|---|---|---|---|---|---|---|
| 2018 | -27 | -27 | ||||||||||
| 2019 | -2 | -31 | -30 | 0 | -24 | -23 | -22 | -50 | ||||
| 2020 | -22 | -24 | -34 | -35 | -34 | -24 | -28 | |||||
| 2021 | -27 | -13 | -74 | -23 | -12 | -52 | ||||||
| 2022 | -34 | -31 | -33 | -28 | -26 | -70 | -34 | -27 | -69 | -15 | -47 | |
| 2023 | -33 | -38 | -27 | -35 | ||||||||
| - = No Data Reported; -- = Not Applicable; NA = Not Available; W = Withheld to avoid disclosure of individual company data. |
| Release Date: 3/29/2024 |
| Next Release Date: 4/30/2024 |