|
Download Data (XLS File) |
|
||||||||
|
||||||||
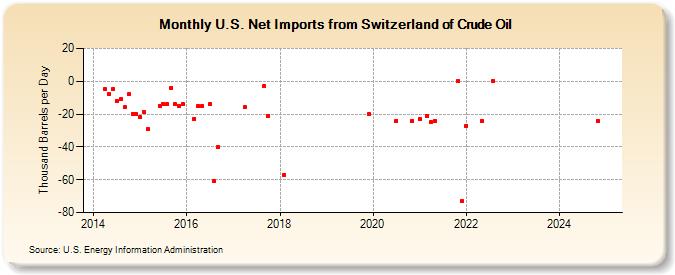
| U.S. Net Imports from Switzerland of Crude Oil (Thousand Barrels per Day) | ||||||||
| Year | Jan | Feb | Mar | Apr | May | Jun | Jul | Aug | Sep | Oct | Nov | Dec |
|---|---|---|---|---|---|---|---|---|---|---|---|---|
| 2014 | -5 | -8 | -5 | -12 | -11 | -16 | -8 | -20 | -20 | |||
| 2015 | -22 | -19 | -29 | -15 | -14 | -14 | -4 | -14 | -15 | -14 | ||
| 2016 | -23 | -15 | -15 | -14 | -61 | -40 | ||||||
| 2017 | -16 | -3 | -21 | |||||||||
| 2018 | -57 | |||||||||||
| 2019 | -20 | |||||||||||
| 2020 | -24 | -24 | ||||||||||
| 2021 | -23 | -21 | -25 | -24 | 0 | -73 | ||||||
| 2022 | -27 | -24 | 0 | |||||||||
| - = No Data Reported; -- = Not Applicable; NA = Not Available; W = Withheld to avoid disclosure of individual company data. |
| Release Date: 3/29/2024 |
| Next Release Date: 4/30/2024 |