|
Download Data (XLS File) |
|
||||||||
|
||||||||
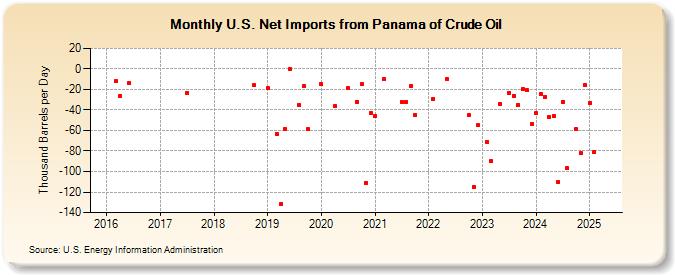
| U.S. Net Imports from Panama of Crude Oil (Thousand Barrels per Day) | ||||||||
| Year | Jan | Feb | Mar | Apr | May | Jun | Jul | Aug | Sep | Oct | Nov | Dec |
|---|---|---|---|---|---|---|---|---|---|---|---|---|
| 2016 | -12 | -26 | -14 | |||||||||
| 2017 | -23 | |||||||||||
| 2018 | -16 | |||||||||||
| 2019 | -19 | -63 | -132 | -59 | 0 | -35 | -17 | -59 | ||||
| 2020 | -15 | -36 | -19 | -32 | -15 | -111 | -43 | |||||
| 2021 | -46 | -10 | -32 | -32 | -17 | -45 | ||||||
| 2022 | -29 | -10 | -45 | -115 | -55 | |||||||
| 2023 | -71 | -90 | -34 | -23 | -26 | -35 | -20 | -21 | -54 | |||
| 2024 | -43 | -24 | -27 | -47 | -46 | -110 | ||||||
| - = No Data Reported; -- = Not Applicable; NA = Not Available; W = Withheld to avoid disclosure of individual company data. |
| Release Date: 8/30/2024 |
| Next Release Date: 9/30/2024 |