|
Download Data (XLS File) |
|
||||||||
|
||||||||
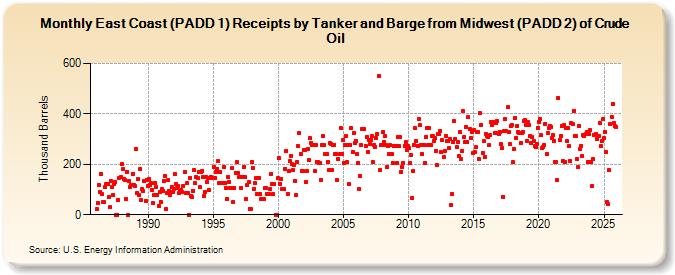
| East Coast (PADD 1) Receipts by Tanker and Barge from Midwest (PADD 2) of Crude Oil (Thousand Barrels) | ||||||||
| Year | Jan | Feb | Mar | Apr | May | Jun | Jul | Aug | Sep | Oct | Nov | Dec |
|---|---|---|---|---|---|---|---|---|---|---|---|---|
| 1986 | 23 | 48 | 116 | 92 | 163 | 81 | 50 | 49 | 111 | 122 | 121 | 70 |
| 1987 | 29 | 135 | 109 | 78 | 122 | 130 | 0 | 0 | 59 | 147 | 150 | 202 |
| 1988 | 180 | 141 | 138 | 64 | 171 | 0 | 135 | 110 | 117 | 163 | 119 | 114 |
| 1989 | 262 | 86 | 140 | 77 | 182 | 57 | 103 | 93 | 132 | 55 | 139 | 112 |
| 1990 | 143 | 119 | 124 | 100 | 48 | 78 | 126 | 110 | 78 | 34 | 90 | 52 |
| 1991 | 103 | 96 | 134 | 154 | 22 | 87 | 137 | 96 | 80 | 108 | 91 | 104 |
| 1992 | 161 | 120 | 105 | 112 | 85 | 95 | 100 | 91 | 115 | 169 | 88 | 124 |
| 1993 | 87 | 0 | 147 | 75 | 71 | 96 | 176 | 125 | 151 | 146 | 168 | 108 |
| 1994 | 171 | 173 | 148 | 76 | 91 | 150 | 130 | 147 | 97 | 151 | 145 | 147 |
| 1995 | 190 | 146 | 169 | 182 | 214 | 127 | 168 | 125 | 125 | 190 | 127 | 107 |
| 1996 | 64 | 151 | 129 | 107 | 106 | 187 | 50 | 105 | 166 | 208 | 166 | 148 |
| 1997 | 149 | 107 | 150 | 148 | 191 | 148 | 63 | 119 | 128 | 23 | 22 | 209 |
| 1998 | 187 | 104 | 125 | 146 | 84 | 145 | 146 | 83 | 62 | 63 | 62 | 105 |
| 1999 | 105 | 84 | 83 | 82 | 102 | 163 | 122 | 82 | 122 | 0 | 0 | 144 |
| 2000 | 224 | 122 | 142 | 101 | 102 | 101 | 182 | 254 | 84 | 172 | 213 | 234 |
| 2001 | 201 | 177 | 199 | 133 | 80 | 211 | 272 | 324 | 241 | 174 | 172 | 258 |
| 2002 | 258 | 130 | 174 | 260 | 217 | 303 | 286 | 278 | 277 | 173 | 277 | 209 |
| 2003 | 209 | 207 | 207 | 138 | 276 | 311 | 275 | 240 | 240 | 211 | 176 | 283 |
| 2004 | 282 | 176 | 278 | 277 | 241 | 241 | 137 | 223 | 239 | 345 | 241 | 295 |
| 2005 | 205 | 277 | 312 | 208 | 277 | 120 | 275 | 343 | 249 | 325 | 285 | 294 |
| 2006 | 240 | 206 | 102 | 154 | 275 | 342 | 341 | 341 | 274 | 308 | 249 | 298 |
| 2007 | 282 | 296 | 311 | 208 | 276 | 269 | 304 | 320 | 551 | 176 | 276 | 276 |
| 2008 | 327 | 288 | 312 | 276 | 190 | 274 | 242 | 275 | 240 | 206 | 274 | 274 |
| 2009 | 274 | 205 | 307 | 273 | 307 | 170 | 190 | 206 | 274 | 290 | 255 | 273 |
| 2010 | 264 | 205 | 238 | 68 | 173 | 276 | 343 | 292 | 274 | 380 | 355 | 276 |
| 2011 | 242 | 277 | 277 | 207 | 310 | 343 | 275 | 344 | 276 | 311 | 311 | 294 |
| 2012 | 303 | 253 | 198 | 322 | 320 | 333 | 247 | 295 | 229 | 253 | 313 | 292 |
| 2013 | 292 | 265 | 300 | 38 | 83 | 287 | 370 | 301 | 269 | 290 | 232 | 329 |
| 2014 | 223 | 252 | 410 | 309 | 288 | 349 | 288 | 386 | 339 | 305 | 330 | 244 |
| 2015 | 335 | 247 | 267 | 329 | 329 | 221 | 402 | 357 | 246 | 291 | 230 | 320 |
| 2016 | 313 | 307 | 275 | 316 | 368 | 357 | 368 | 323 | 363 | 373 | 324 | 322 |
| 2017 | 330 | 279 | 264 | 72 | 331 | 378 | 331 | 427 | 329 | 280 | 353 | 354 |
| 2018 | 208 | 260 | 385 | 305 | 350 | 330 | 325 | 285 | 323 | 328 | 373 | 374 |
| 2019 | 357 | 293 | 366 | 355 | 311 | 283 | 308 | 292 | 271 | 267 | 282 | 345 |
| 2020 | 368 | 379 | 317 | 263 | 269 | 277 | 360 | 240 | 323 | 343 | 353 | 349 |
| 2021 | 303 | 316 | 294 | 211 | 208 | 136 | 464 | 297 | 311 | 352 | 213 | 355 |
| 2022 | 209 | 344 | 291 | 345 | 271 | 214 | 362 | 358 | 413 | 314 | 314 | 223 |
| 2023 | 189 | 352 | 261 | 273 | 233 | 317 | 311 | 320 | 328 | 210 | 319 | 335 |
| 2024 | 208 | |||||||||||
| - = No Data Reported; -- = Not Applicable; NA = Not Available; W = Withheld to avoid disclosure of individual company data. |
| Release Date: 3/29/2024 |
| Next Release Date: 4/30/2024 |